I’ve recently completed an ELK (Elasticsearch, Logstash & Kibana) real-time log processing implementation for an HTML5 FX trading platform. Along the way I’ve learnt a few things I wish I’d known beforehand. This post shares some more details of the project and hopefully some time saving tips.
ELK

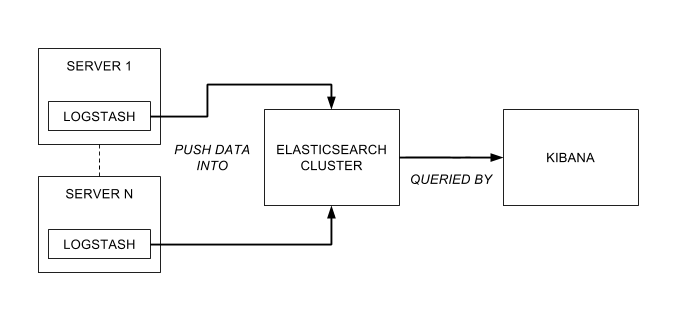
The ELK stack is made up of 3 components -
-
Logstash - An agent which normally runs on each server you wish to harvest logs from. Its job is to read the logs (e.g. from the filesystem), normalise them (e.g. common timestamp format), optionally extract structured data from them (e.g. session IDs, resource paths, etc.) and finally push them into elasticsearch.
-
Elasticsearch - A distributed indexed datastore which normally runs in a single cluster. It’s job is to reliably store the incoming log data across the nodes in the cluster and to service queries from Kibana.
-
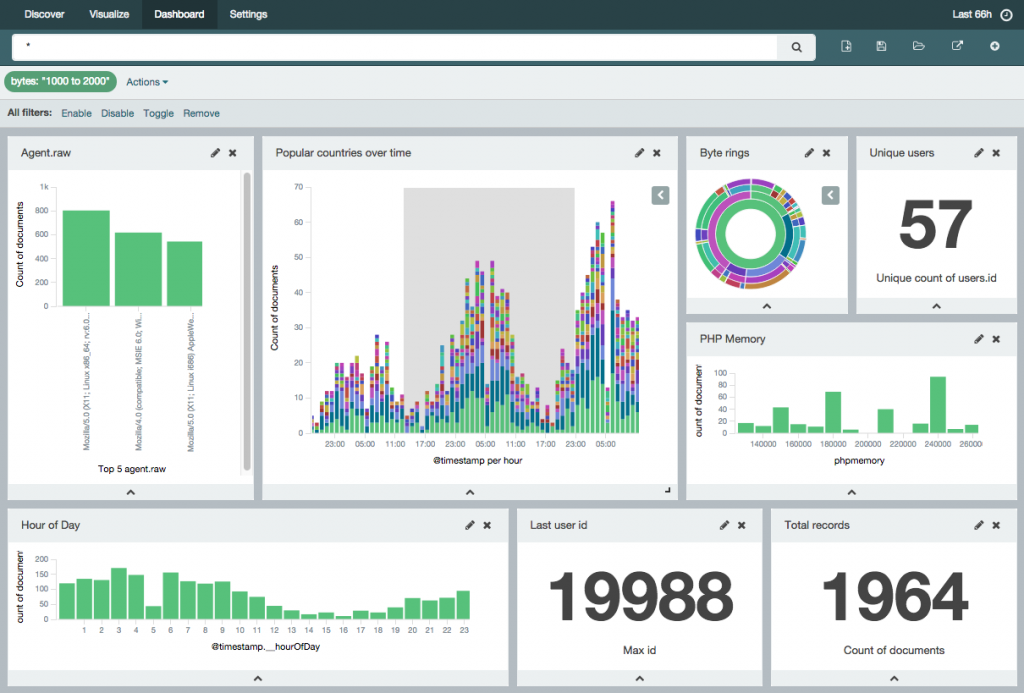
Kibana - A browser-based interface served up from a web server. It’s job is to allow you to build tabular and graphical visualisations of the log data based on elasticsearch queries. Typically these are based on simple text queries, time-ranges or even far more complex aggregations.

A brief case study
The platform in question was a real-time FX trading system supporting 100s of concurrent client connections. Supporting this were 10s of multiply redundant services spread across 10s of Windows and Linux servers straddling a DMZ and internal network. As is typical of such systems, there were strict security policies governing communication between these services.
The existing system used a batch process to harvest the logs from all of the servers to a file share every 30mins. Alongside the huge latency, analysing these logs was a laborious and slow process. As a result, the logs were either overlooked as a valuable source of data and decisions were made based on subjective rather than objective measures.
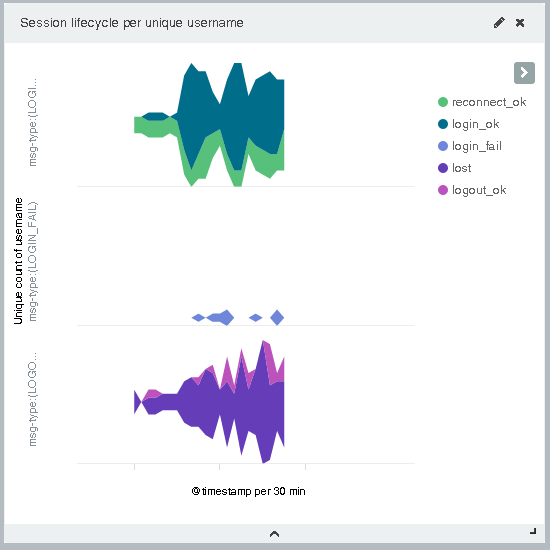
The ELK implementation greatly simplified the aggregation and searching of data across these servers. Tracing problems across services or collecting metrics on bug fixes and infrastructure upgrades can all easily done in real-time through a simple web interface. It was found that log messages including correlation keys, for example session or transaction IDs were especially ripe for analysis.
Simple examples of this were unique session counts over time, live concurrent session lifecycle overviews and even breakdowns of the session load by service. A particularly valuable example was a real-time conversion rate of FX quotes, showing not only how many quotes were being requested over time but the ratio of those which were eventually traded.

Over time the ELK stack will allow for the replacement of bespoke components, for example those collecting usage data for audit purposes. Using Kibana, these statistics are now easily made available in a real-time dashboard. Similarly, valuable business statistics which were previously judged too costly to extract from the logs can now be made available at a greatly reduced cost.
3 things I wish I’d known…
Now that the system is implemented it’s easy to forget some of the tricks I’ve learnt along the way. Here’s my top 3 -
Logstash 1.4.2 file input doesn’t work on Windows
The short version is that it can be painfully massaged to work but you’ll be much better off finding an alternative way of reading logs on Windows.
Wildcards don’t work. Well actually they do, you’ve just got to make sure you use the right syntax e.g. C:/folder/* or C:/**/log. However, they still won’t really work…
To be useful, the file input plugin needs to store it’s current location in the file. It does this in a sincedb file (stored in %SINCEDB_PATH%/.sincedb_<MD5>, %HOME%/.sincedb_<MD5> or the path specified). Within the file is a simple mapping of file identifier (major/minor device id and inode id) to byte offset. Unfortunately the implementation always returns an inode id of 0 on Windows. As you can no doubt imagine this causes a few problems if your wildcard matches more than one file.
The workaround is to specify each potential match of the wildcard as a separate file section each with its own unique sincedb_path. Just specifying multiple paths doesn’t work because only one sincedb file will be created.
One final sting in the tail is the file locking. If your log appender attempts to rename the log file or anything of the sort then the lock retained by the plugin will prevent it from doing so with fun consequences. Not all log appenders have this behaviour so you might not suffer from this.
This is the sample snippet of a working configuration (with the above disclaimers) -
input {
	file {
		path => "c:/elk/logs/sample.log"
		start_position => beginning
		sincedb_path => "c:/elk/logs/sample.log.sincedb"
	}
	file {
		path => "c:/elk/logs/error.log"
		start_position => beginning
		sincedb_path => "c:/elk/logs/error.log.sincedb"
	}
}
It isn’t all bad news though, the sincedb bug is actively being worked on and the file locking bug is at least known but progress seems to be glacial.
Logstash grok is more powerful than I thought
The getting started guide gives some good basic examples of grok match patterns -
match => { "message" => "%{COMBINEDAPACHELOG}" }

match => { "message" => "%{SYSLOGTIMESTAMP:syslog_timestamp} %{SYSLOGHOST:syslog_hostname} %{DATA:syslog_program}(?:\[%{POSINT:syslog_pid}\])?: %{GREEDYDATA:syslog_message}" }
However, there were a couple of things that weren’t obvious to me: where were these patterns defined and do I need to create my own patterns? In reality I should have skipped straight to the grok docs, but here’s what I puzzled out on my own…
The patterns are defined in the patterns folder in your installation directory. There are a lot of useful patterns predefined and it’s obvious how to add your own. However, for one-off patterns there’s an inline syntax that you can also use -
(?<resource>\w+\d+)And you can also mix and match -
(?<timestamp>%{DATESTAMP} %{ISO8601_TIMEZONE})Also, if you need to perform any kind of statistical analysis any numbers you’ll need to tell Logstash to create them as numeric fields in Elasticsearch -
%{INT:latency:int}And finally don’t forget about conditionals. A few times I found myself creating a monster of a regex when some simple conditional parsing would have made life much easier. However, if you are stuck with a monster regex, then grokdebug can be a lifesaver!
What are these <field>.raw fields and where did they come from?
The first time I saw the data loaded into Elasticsearch and visible in Kibana, aside from a great sense of relief, I spotted a bunch of fields I wasn’t expecting. All of the string fields I’d mapped in Logstash had equivalent <field-name>.raw fields. I guessed that Logstash must have created them but I wasn’t sure what they were for.
Logstash did indeed create them by defining a dynamic type mapping for all string fields in logstash-* indices -
"string_fields" : {
  "match" : "*",
  "match_mapping_type" : "string",
  "mapping" : {
    "type" : "string", "index" : "analyzed", "omit_norms" : true,
    "fields" : {
      "raw" : { "type": "string", "index" : "not_analyzed", "ignore_above" : 256 }
    }
  }
}
The above configuration defines the main field as an analyzed field and the raw sub-field as a not_analyzed field. An analyzed field is one in which elasticsearch has parsed out the tokens for effective searching. That means it’s not much cop for sorting or aggregating as explained in the docs.
You know, for logs
The ELK stack is an incredibly powerful tool which really can revolutionise how logs are viewed. Awful puns aside, it’s a powerful and versatile stack that can seriously optimise the workload of operations, and at the same time expose fresh insights to business.


