
While d3fc (a toolkit of charting components built in the d3 style) embraces the philosophy of simplicity over performance, there’s no point in creating a chart with lousy performance. In this post I’ll run through some of the tips and tricks for squeezing the best performance out of d3fc without compromising on its flexibility.
What are we aiming for?
The holy grail of any visualisation in the browser is to achieve 60 frames per second. Without relying on exotic tricks that’s around the framerate that we (humans) perceive as continuous motion, and through no strange coincidence, the maximum framerate the browser will render at. There are two things worthy of note -
- 60 fps translates to 16.66ms to render each frame. Once you subtract any layout and painting time, that can leave approximately 10ms for your code to do its business.
- There’s no point hitting the 10ms render time 90% of the time, that will just lead to perceptible jank in the rendering. If you’re aiming for 60 fps you need to hit that ~10ms 100% of the time.
One easy way to fix performance issues is to short-circuit code paths such that event handlers directly trigger rendering of affecting areas of the screen. Whilst this can lead to significant performance gains, it is very much at the cost of maintainability. Instead of the visualisation being a function of its model, it is now a function of its model and a contorted sequence of mutations.
If we’re to avoid this, that means we’re aiming to render the chart completely from the model within the allotted 10ms processing time.
Where are we now?
Before diving in, let’s quickly review what the performance is like currently and how a chart is typically rendered in d3fc. Chrome’s Timeline view is a good place to see what the performance is currently like -
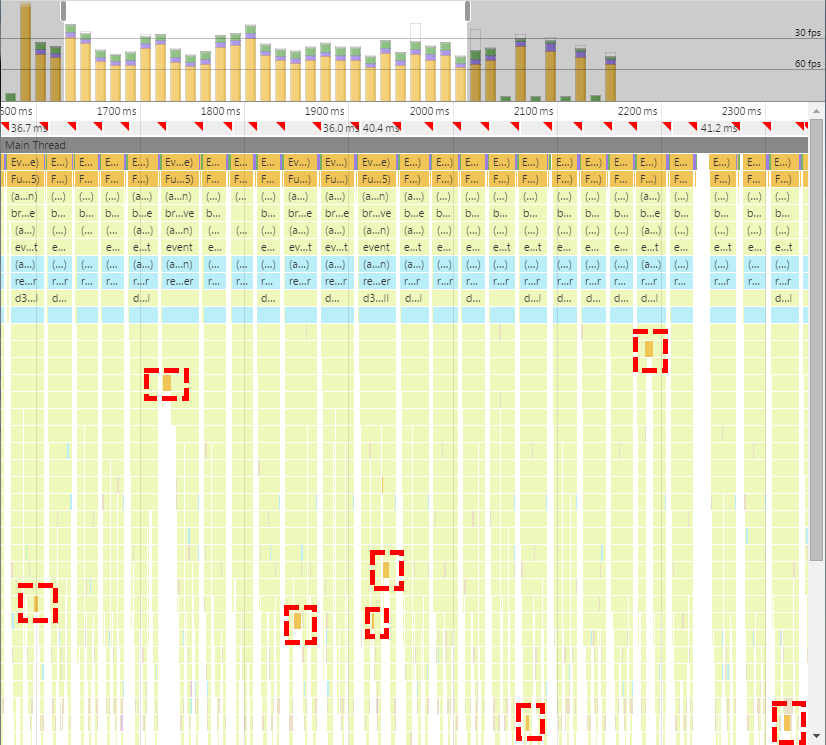
Not good! A few things to note -
- The red triangles are signalling that we’re missing the 60fps target
- The bar chart at the top shows sometimes we’re missing the 30fps target
- The red dashed boxes highlight the GC pauses
And let’s quickly remind ourselves of the (typical) pattern that’s currently being used -
var data = ...;
var container = ...;
function render() {
    container.datum(data);

    var mainChart = ...;
    mainChart.on('event', render);
    container.select('#main')
        .call(mainChart);

    var volumeChart = ...;
    volumeChart.on('event', render);
    container.select('#volume')
        .call(volumeChart);

    var navigatorChart = ...;
    navigatorChart.on('event', render);
    container.select('#navigator')
        .call(navigatorChart);
}
render();
On each interaction, we’re relying on D3’s inherent idempotent rendering capabilities and re-creating all of our components on each render. Whilst this pattern (clearly!) has a number of disadvantages which we’ll come on to, it does fulfil our requirement of fully re-rendering the chart from the model on every interaction.
Components all the way down
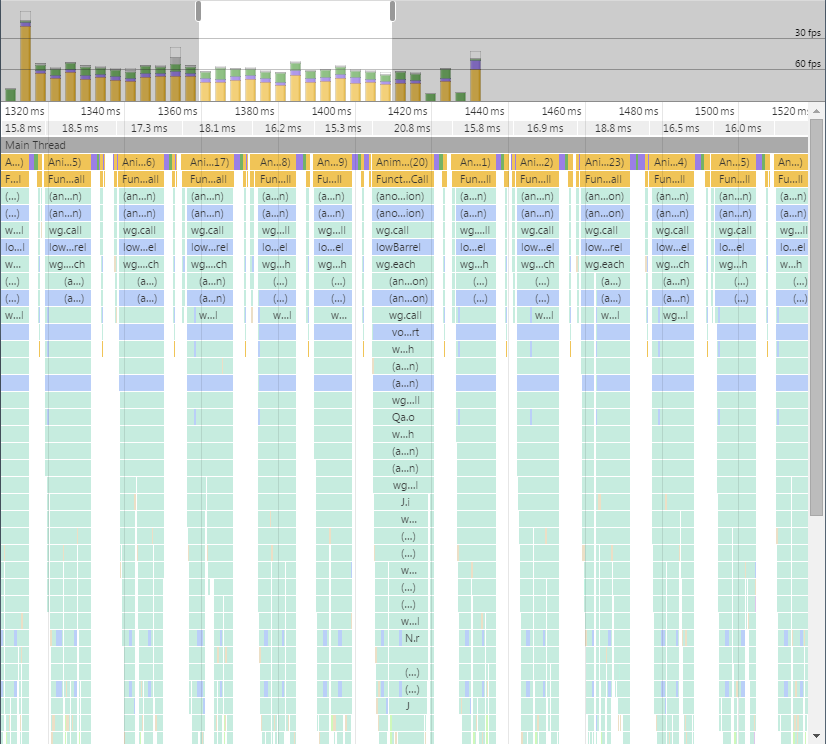
As we saw, the timeline was littered with GC pauses. Whilst there’s not a lot you can do to directly control when GC happens, if it’s happening a lot that’s a hint you could be doing something more memory efficiently.
In this case we’re re-creating our components (i.e. mainChart, volumeChart and navigatorChart) unnecessarily every time we render the chart. If we instead were to move their construction to outside the render loop and maintain references to them, we could eliminate the memory thrashing, as well as saving ourselves some processing time.
var data = ...;
var container = ...;

var mainChart = ...;
mainChart.on('event', render);

var volumeChart = ...;
volumeChart.on('event', render);

var navigatorChart = ...;
navigatorChart.on('event', render);

function render() {
    container.datum(data);

    container.select('#main')
        .call(mainChart);

    container.select('#volume')
        .call(volumeChart);

    container.select('#navigator')
        .call(navigatorChart);
}
render();
Moving the components outside of the render loop does make the code a bit messier. Ideally we only really want our top-level code to create a single root component, so we just move the code from the top-level into it’s own component -
var data = ...;
var container = ...;

var chart = ...;
chart.on('event', render);

function render() {
    container.datum(data)
        .call(chart);
}
render();
This keeps the component pattern consistent throughout our code and stops the top level render becoming the typical dumping ground of procedural code.
This is in effect, a (liberal) interpretation of the Flux pattern. In Flux, user interactions are modelled as actions which propagate through to a top-level dispatcher, then into a store which performs the business logic (mutating the model) and then kicks off a render utilising a virtual-DOM to improve performance (by minimising DOM operations). In our code, user interactions are modelled as events which propagate to the top level which performs the business logic (mutating the model) and then kicks off a render utilising d3’s update pattern to improve performance (by minimising DOM operations). Note that in both patterns user interactions always propagate to the top-level before being acted upon, there is no short-circuiting of rendering logic.
Optimising the series
Out of the box d3fc fc.series.bar and fc.series.candlestick components allow for decorate-ing each rendered data point. This is really useful if you want to add labels to your data-points or customise them in some other bespoke way. However, the internals of how the series allow decoration means you’re paying a performance penalty if you’re not making use of that functionality.
As we don’t need to decorate our series, it would make sense to skip the series and make use of the lower-level components fc.svg.bar and fc.svg.candlestick. These lower-level components are essentially just SVG path string generators so we no longer have a DOM node for each data-point. This means styling data-points individually or dealing with events per data-point is harder, but you get faster rendering by only modifying a single DOM node.
I’ve described this process in more detail in a previous blog post.
Throttling with requestAnimationFrame
Now that we’ve managed to bring down the render time, we’re still failing to hit 60fps because we’re sometimes attempting to render multiple times within a single frame. By responding directly to user events (i.e. mouse movements) the browser is running the corresponding handlers as quickly as possible. It does not attempt to throttle the handlers to once per frame, even though that’s as fast as the user will see updates.
To get around this, we need to change our approach. On each handler invocation we still want to apply the appropriate delta to the model but we don’t want to immediately render. Instead, we schedule a render to occur once per frame based on the state of the model at that point in time. This will include the accumulated deltas from all handlers that ran within the frame.
We can do this using requestAnimationFrame and some simple throttling logic -
function renderInternal() {
    ...;
}

var rafId = null;
function render() {
    if (rafId == null) {
        rafId = requestAnimationFrame(function() {
            rafId = null;
            renderInternal();
        });
    }
}
Each event handler calls render as before but internally render now schedules the actual call to renderInternal to happen at most once per frame. This functionality is now exposed in the library as fc.util.render -
var render = fc.util.render(function() {
    ...
});
Avoiding browser reflows
Currently the chart mixes HTML and SVG nodes to produce the desired layout (styling removed for brevity) -
<table id="container">
    <tr>
        <td><svg id="main"/></td>
        <td>OHLC</td>
    </tr>
    <tr>
        <td><svg id="volume"/></td>
        <td>Volume</td>
    </tr>
    <tr>
        <td><svg id="navigator"/></td>
    </tr>
</table>
Interlacing the reads and writes of layout-sensitive DOM properties, causes multiple reflows. In this case the .layout() call within each chart first triggers a synchronous layout by attempting to measure the containing element (via fc.util.innerDimensions) and then, by setting SVG attributes (width/height), triggers a layout invalidation.
We can avoid these multiple reflows by removing the multiple calls to fc.util.innerDimensions. Internally, the .layout() logic has been enhanced to only measure a node if it hasn’t already been assigned dimensions by a .layout() call to an ancestor node. Therefore we can remove all but the first call to fc.util.innerDimensions by moving all of the chart panels into one top-level SVG node rather than mixing DOM layout with SVG .layout() -
<svg id="container">
    <g layout-style="flex: 0.65; flexDirection: row">
        <svg id="main" layout-style="flex: 1"/>
        <text layout-style="width: 50">OHLC</text>
    </g>
    <g layout-style="flex: 0.2; flexDirection: row">
        <svg id="volume" layout-style="flex: 1"/>
        <text layout-style="width: 50">Volume</text>
    </g>
    <g layout-style="flex: 0.15; flexDirection: row">
        <svg id="navigator" layout-style="flex: 1"/>
    </g>
</svg>
The code requires only a small change to perform a top-level .layout() prior to calling the components. This means that when the nested components internally call .layout() the values from the top-level .layout() are re-used.
function render() {
    container.datum(data)
        .layout()
        .call(chart);
}
render();
Avoiding layout calculations altogether
Whilst removing the forced synchronous layouts speeds things up, there’s still a non-zero cost to the .layout() code. As layout code is not required for the vast majority of chart operations (with the exception of e.g. resizing), the .layout() code has also been modified internally to respect a flag which allows for suspending it manually.
var render = fc.util.render(function() {
    container.datum(data)
        .layout()
        .call(chart)
        .layoutSuspended(true);
});
render();
This could be considered a cheat based on the initial requirements of rendering from the model each time and, to be honest, it is! The only lame mitigation I can think of is that the .layout() operation is a function of the current DOM state (i.e. the layout-* attributes) rather than the model, it is already an exception to the rule. However, that doesn’t hold much water as an argument e.g. the entire chart is a function of the dimensions of the DOM. Therefore this is an area which is likely to evolve over time so watch this space.
The results
There are still some performance issues I’d like to investigate on older browsers and certain mobile platforms, but it renders much more consistently at 60fps on most platforms/browsers.
I’ve got some more ideas around further improving performance by embracing more ideas from the Flux ecosystem, specifically around Immutable.js, but as we’ve hit the target I’m going to save those for another day. If you’re interested in the specific changes I made to improve the low barrel example, they’re available on this pull request.