The next version of D3, the data visualisation library, is on the way. As we maintain D3FC (a charting library built on top of D3) we want to stay on top of those changes, to make sure that the library makes appropriate use of any new functionality and to embrace any new conventions that have emerged.
One of the major changes is the splitting up (or modularisation) of the library into completely separate, independent modules which then depend on one another as appropriate. This means that you only need to pull the exact module you need into your project, as opposed to having to pull in the whole D3 library, as you do currently.
For example the d3-voronoi does not depend on any other D3 modules, so obviously you shouldn’t need to bring in any of them, which will now be the case in version 4. This will reduce the size of your JS bundle, which should hopefully mean things zip along.
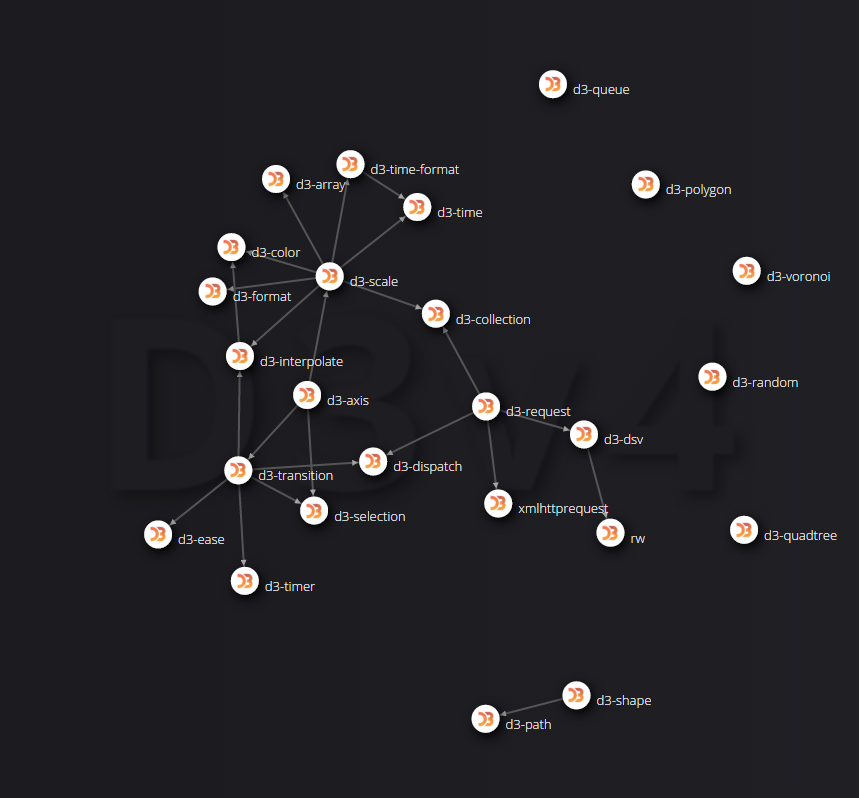
This modularisation reflects what D3 conceptually already is, a library of separate modules. Some depend on other modules, but some are completely independent. As D3FC is a very similar beast, we thought we’d look into how D3 was split up to establish the best pattern for D3FC. Thus this funky D3 visualisation was born!
The visualisation works by fetching the metadata for all the D3 modules, which are now published as separate npm modules, reads the dependencies for each module, then takes that data and draws the force layout graph showing the relationships between each of the modules. We haven’t thought of a use for this yet, but, it looks cool…
Check out the code at the GitHub repository


