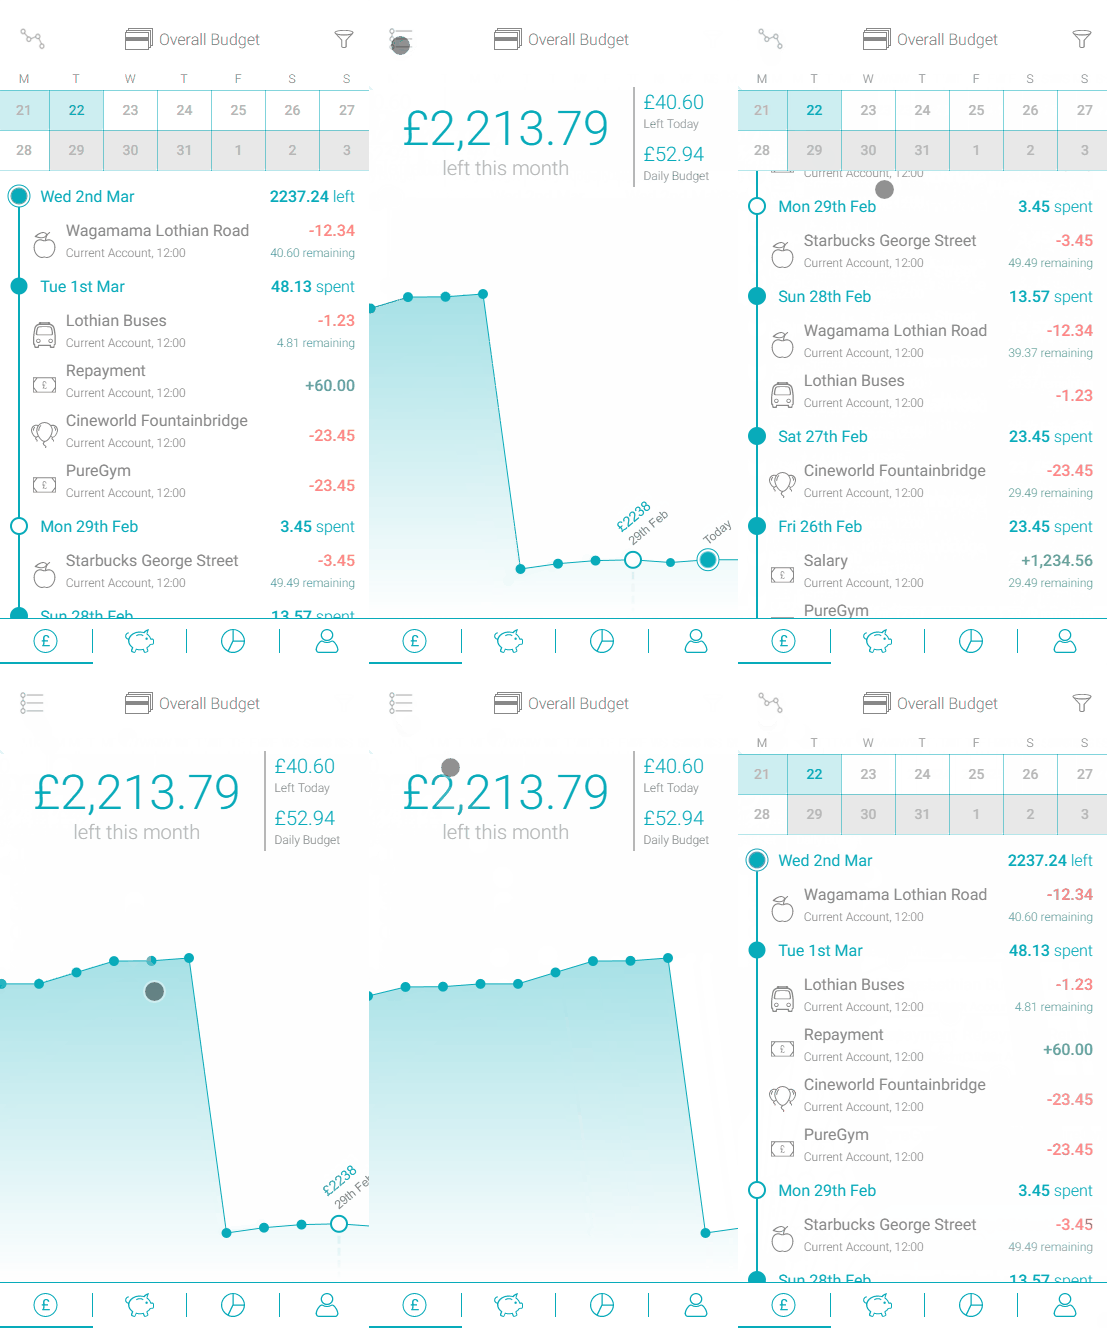
For the past few weeks, Laurie Collingwood and myself have been working on a prototype banking app with an animated graph. In this post we’ll discuss some of what we’ve learned during the project and talk generally about animation with HTML5 canvas.

Designed by Scott Logic’s UX team, the app gives the user more information about their spending, utilising animation to demonstrate the relationship between their transactions and their budget. For more about the design be sure to check out Rui’s post.
Canvas vs SVG
Our first task in developing the prototype was to decide how to make the animation. We opted not to use an animation or charting library and this left us with the choice of canvas vs SVG.
Our reasons for choosing to work with canvas over SVG were its performance and ease of use. In our reading, canvas’ supposed speed benefits were often touted as a reason to choose it for complex animation or drawing tasks. Without getting into too much detail, the crucial factor in our project was that rendering to canvas is generally quicker. For this performance boost we pay the price of losing the ability to select elements of the drawing and assign event handlers to them.
As click and hover events did not feature in the mobile-oriented design spec and we did not need to take advantage of SVG scaling, canvas’s performance put it ahead of SVG for our purpose. We also liked the API: the ‘tearable cloth’ example served as inspiration, showing how easy it can be to create complex animations with canvas.
If you’re keen to learn more about canvas’s performance advantages, Scott Logic bloggers Chris and Ali each touched on this in posts recently in their respective posts D3 Path, What Is It Good For? and D3FC ❤ Canvas.
Animating the Chart
First, we created lines whose endpoints can move independently, the core building blocks of the chart. Here is an example showing how to implement this using canvas:
In the simple animation above, we can see that the render ‘loop’ is a recursive function, renderFrame. First a frame is drawn to the canvas, then a call is made to window.requestAnimationFrame to schedule the next frame.
The state of the animation is determined not by how many frames have passed but by the time since the animation began. So to track constant-velocity motion of single point along a straight path we use the following formula:
currentLocation = start + (destination - start) * (timeElapsed / duration)
Similar time-based formulae can be used to calculate the transparency of objects which fade in and out, such as the background fill and text in the banking app.
Scrolling
One particular challenge in developing the chart was implementing scrolling. This was non-trivial due to the relationship between the scroll positions of the graph and the list, i.e. that the left hand side of the graph corresponds to the bottom of the list while the right hand side corresponds to the top. For example, if the user is viewing the last items on the list then the transformation should take them to the far left of the chart.
We took care of this by tracking the horizontal scroll position in the graph view and the vertical scroll position in the list view. The canvas was only the size of the viewport and the ability to scroll was achieved by placing an empty div element, as wide as the graph and as tall as the list, in front of the canvas. The div was contained in another element whose size was equal to that of the canvas.
The position of the canvas relative to the screen was fixed but by tracking changes in the scrollTop or scrollLeft properties of our empty div and updating the canvas content to move in sync, we created the appearance of scrolling. When the animation from graph to list (or vice versa) took place, user scrolling was temporarily disabled and the scroll position of the invisible div was set such that it fitted with the new contents of the canvas.
This worked well on desktop browsers, but one mobile browser we tried was not compatible because it would only report an element’s scroll position once scrolling had stopped. To remedy this issue we replaced the blank div with a second canvas onto which we render a single frame, achieving the same effect without the need to continue rendering the canvas while the animation is not taking place.
To sum up
In spite of a few challenges, such as enabling our scrolling strategy on a mobile browser, overall we feel that canvas is a great choice for a custom animation and can recommend it for a project with similar demands to the app described above.


