
In this post we’ll take a whistle-stop tour around the topic of data, going from sources and types through to use cases and the technologies involved in processing data.
We’ll briefly explore the conflicting requirements around data and emphasise the need for everyone to think about it in the development process, rather than treating data as an afterthought where its value won’t be properly maximised.
Introduction
Over the last decade we’ve heard more and more about data. Firms feel they should be embracing big data, everyone talks about being data driven and recently AI and machine learning, which is powered by data, has really taken off
Despite this, there is a certain amount of mystique around the area for many engineers and managers: often data responsibilities are handed off to an unknown data team who manage the data platform. Unfortunately, as a result, it doesn’t always deliver what was hoped for - I’ve witnessed confusion around the role of the big data system (e.g. Spark) vs the older warehouse, an inability for BAs to find the data they need or even to know what data is available where, arguments over whether the data platform should be used in operational flows and frustrations when managers want real time insights but can’t get them.
I’d argue (not very controversially) that this siloed, hand-it-off approach isn’t great and we need to treat data requirements like any other as a first class citizen that everyone is involved in. Yes, sometimes data requirements demand data engineering or ML expertise and different tooling compared to the online transactional workloads but nonetheless we should understand the use cases and where our tools and people are well suited and where not.
Types of data
To start let’s think about the types of data flying around a typical organisation and to illustrate this, consider the diagram below showing some examples of what might be ingested into and generated by a financial products app:
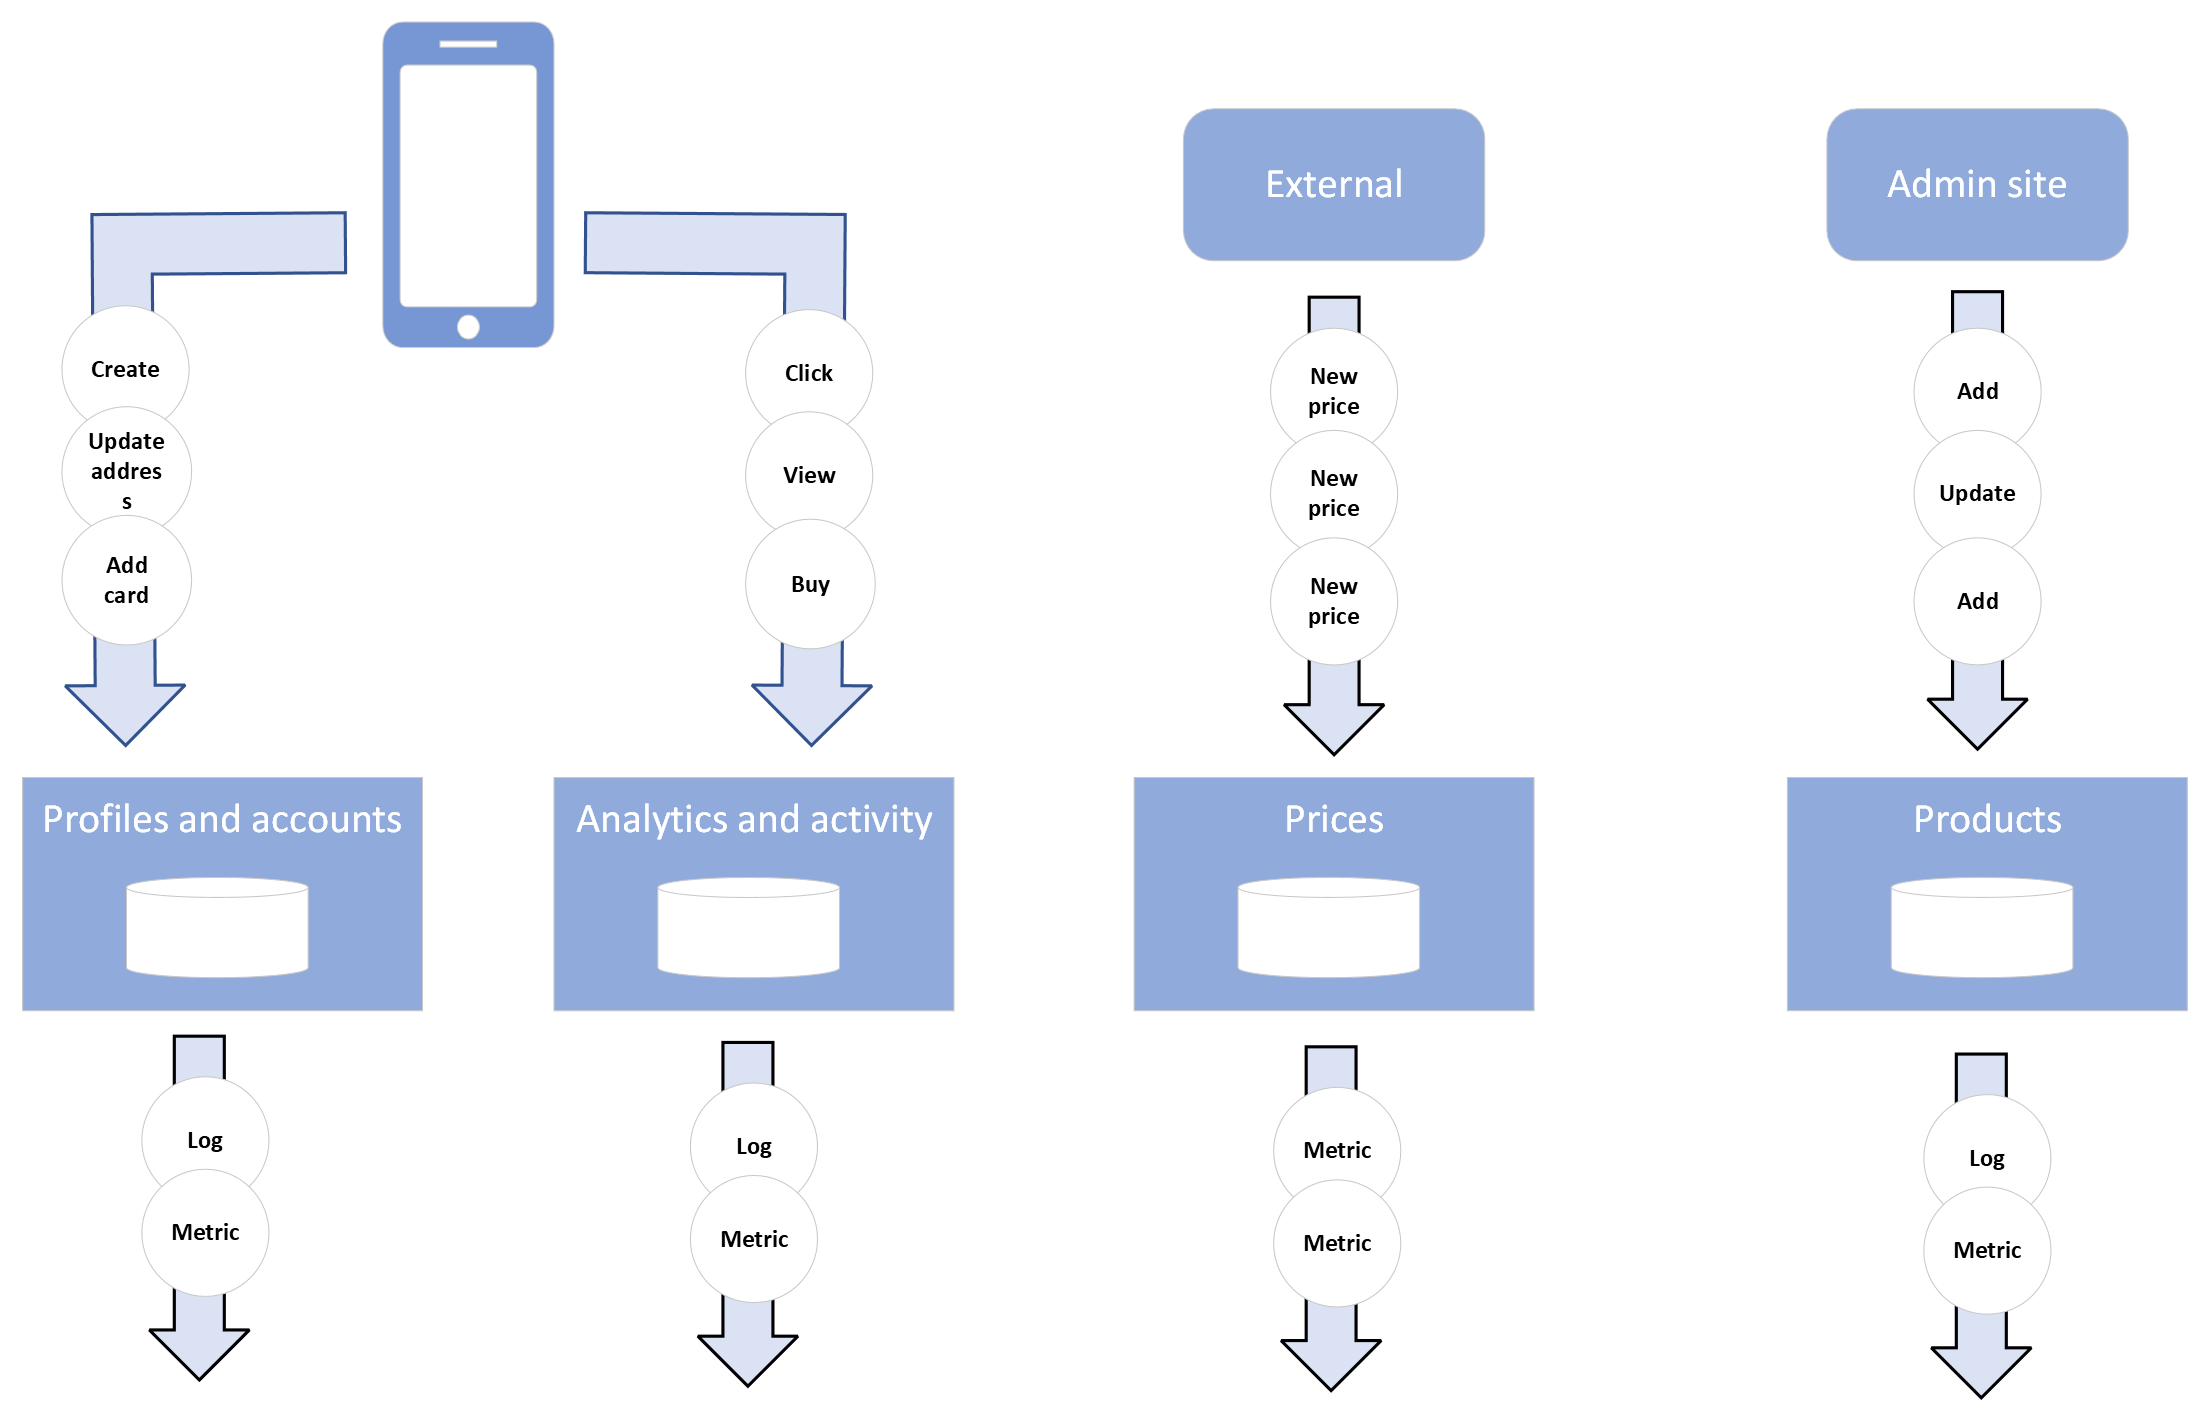
We see a number of classes of data:
- system data like logs and metrics from the services we run
- customer data, like someone’s address, email, preferences and account information
- activity data – from views and clicks to purchases
- product data about goods or services
- external enrichment data like time series price data being pulled in
It’s clear even from this simple example that the data in an orginisation is varied in nature and in its use. Some of the data may be at the centre of what a company does, sometimes it’s more on the periphery but all is valuable.

There’s many different properties of data we could consider but to take a few: some data will be frequent and high volume, other infrequent, some will be sensitive e.g. with PII data, some not and some will be high quality, other poor with missing data or no schema. We may also note a difference between data that communicates changes to state like a user’s address vs event data (e.g. user clicks) vs data that provides a continually changing time-series value like a stock price or the current latency of an API. We see differences in these properties for the examples of data types:
| Data | Event throughput | Sensitivity | Quality | State vs values |
| System logs and metrics | High | Medium | Medium | Values stream |
| Customer data | Low | High | High | Current state |
| Analytics clickstream | High | Medium | Low | Event stream |
| Product catalogue | Low | Low | High | Current state |
| Stock prices | High | Low | High | Values stream |
This implies that a one size fits all approach to ingesting and processing data is unlikely to work.
Usages of data
Let’s move on to consider some of the ways we might want to use that data. We’re thinking here of use cases other than the core task storing of data when a user submits it.

We see a wide variety of use cases varying in the breadth and type data they need, how real time they are, accuracy needs etc. They’ve been drawn overlapping where they are some commonalities, e.g. producing segments for a customer will involve a 360 view of a single customer just as a Subject Access Request (SAR) would. Let’s explore further how we might think about the different use cases. Some common attributes that we’ll explore further are:

Use Case Attributes
Accuracy
What’s the cost of acting on incorrect data or incomplete data. What’s the cost of producing incorrect or insufficiently accurate results. Regulatory reports need to be super accurate. On the other hand missing some late clickstream data about a page view is rarely a problem and won’t affect aggregate statistics.
Latency
How quickly must we act upon the data – batch (e.g. daily, hourly), micro batch (e.g. every 30s or 2 minutes)or real time. In recent years the trend has been towards more near real time data rather than daily or weekly batches. Often this must be traded off against accuracy or require multiple piplines – see literature around streaming watermarks and the Lambda and Kappa architectures.
A financial trading application would sit at the extreme of low latency but security applications or location based advertising use cases must still be quick.
Retention
Are we operating over a short time window or all time – many use cases are only concerned about the most recent data (e.g. logs, security) so we can have an expiry but not in all cases, especially where financial reporting is involved. Machine learning use cases may also want a rich history of data. Sometimes we don’t need all events but rolled up values are needed, e.g. per week figures. Online transactional systems usually care about the final state but in BI analytics sometime we want to know the history, e.g. changes to an order.
Data dimensions to be processed

In transactional systems we are typically fetching or updating a row that is associated with a person or product but in analytics we often want to do aggregates across columns for all users or products within a time window/location/other. In applications like recommendation engines we often work across both dimensions at the same time (e.g. matrix factorisation) and need a lot of memory.
Databases tend to be optimised for one application or another. An online transactional DB supporting high req/s (tens of thousands plus) is unlikely to be optimal for large scale analytic workloads. The preferred data model is also likely to be different with fact tables (including history, see retension section above) and star schemas used for analytics. This implies differences in customer data focused systems vs analytics systems and means we can’t often use the customer facing DBs for reporting and data science, even via separate read replicas. Neither may be well suited to data science calculations.
User/consumer of the data
Sometimes a type of processing or query is setup once and managed by developers, but often a person like a business analyst or financial reporter is regularly writing queries and viewing the results. In other in-between cases a data scientist may be working with the data dynamically via Python or R.
The user will impact the approach because it’s not enough just to have a data service running some code deployed from Github. The interface is important for driving the query and also to visualize and browse the results. We see attempts to offer SQL like interfaces into Kafka, Spark etc but it’s very basic compared to more warehouse focused products.
Tech Solutions
In this section we think about the variety of technology product categories that we can apply to storing, transferring and analysing data. We start with a table summaring the various categories and providing some examples:
| Tech | Use | Examples |
| Message buses | Distribute data from services to other users/systems | AWS Eventbridge, Kafka, RabbitMQ, Azure Service Bus |
| Workflows and orchestrating ETL | Where there's dependencies between data you want to pull into your warehouse and to orchestrate the data flow | Apache Airflow, Google Data Flow |
| Streams and real time processing | Where we must act immediately on a change | Kafka Streams, MS Fabric, Snowflake, Spark, Apache Beam |
| Data lake | A place to throw all your data so that it can be joined and used at some point as needed | HDFS, Deltalake, object storage like S3 |
| Data warehouse | For BI users to query with SQL. Often with star schema and columnar format for fast query | Google Big Query, IBM, Oracle data warehouse products, Snowflake, Databricks, MS Fabric, Vertica |
| Large scale unstructured data analysis | Massive scale analysis on data that is often ill defined, without schema and varied | Spark, Snowflake, Databricks, Big Query |
| ML and AI model training frameworks and services | Training a new model or tuning an off the shelf one. Similar to the above but uses very specific maths techniques – not just general purpose filters and aggregations | Tensorflow (various platforms), AWS Sagemaker, Spark, Big Query |
| Customer data platforms (CDPs) | App analytics and 360 view of each customer across many systems and for segmentation | Adobe, mParticle, Twilio Segment |
| Logs/metrics systems | Collecting logs and metrics at scale, rolling up values, providing alerts | Prometheus+Grafana, Splunk, New Relic |
| SIEM Tools | Analysing logs, customer events etc to identify security threats | Splunk, SolarWinds SEM |
Observations and trends
We can see that a lot of products come up in multiple categories. Everyone from Vertica to Snowflake to Google is offering some form of machine learning capabilities within their main data offerings. Be aware that the flexibility and maturity and programming interfaces will differ so not all will be equal for a given use case. For example, many vendors offer some form of streaming for continual updates but this is typically a form of micro-batch and usually a more recent product add-on so wouldn’t be appropriate for the very high throughput and/or lowest latency applications.
On a related note, in Snowflake we do see some movement to try and unify the analytics DB and the online transactional one with the recent UniStore offering so as to avoid the need to copy data between them but this is a very recent move and time will tell how useful it is.
Certain needs are still implemented with separate products such as providing a 360 customer view. CDPs may have some data science responsibilities, e.g. around segmentation but there’s usually a lot of value add in terms of app SDKs, integrations into marketing platforms, experimentation platforms, push notification/email/SMS integration etc. They’d typically push data they’ve collected into the warehouse system or data lake. Similarly the management of metrics and logs and related security tooling tends to be quite separate today with quite different users in the SRE world and integrations into pager systems, service desk systems etc. In both cases the integrations and what we do as a result of the data are at least as important as the data.
A consequence of vendors trying to offer one-stop-shops for data is that the differentiation between an analytics database and big data frameworks isn’t clear cut nowadays. We have the concept of the data lake and “lakehouses” around the lake to work on the data in different ways, sometimes with an intermediary layer like Delta Lake to provide atomicity, consistency etc (ACID) on the lake. This contrasts with the older scenario of a warehouse DB with the data and then a separately a set of HDFS or S3 files with a replica of that same data to be processed by the likes of Spark or Tensorflow. Vendors are offering the lake and lakehouses together; for example Snowflake lets different users spin up their own data warehouses for different analytics tasks and also offers Snowpark so data scientists can work with its data using Python. Databricks and Fabric have similar features as well as the aforementioned ML/AI capabilities and reporting.

Benefits of this approach include avoiding the need to have the same data copied into lots of locations and managed separately including all the governance requirements around security and PII. Additionally the tooling has improved to manage unstructured data a lot better so we don’t have a swamp of unknown, unusable data. As an aside, ostensibly, some of the most recent ideas around a Data Mesh pull in a slightly different direction but don’t have to. The important point is that the teams that own the data at origin manage it’s availability, schema etc for data use cases rather than a central data team.
Picking your data tooling
We’ve seen that there’s many types of data and lots of different ways to process that data. Rather than shopping for a “Big Data” product and then trying to make it fit your use cases I’d recommend getting a clear view on what you want to achieve and what your requirements are (both today and in the near future) to determine the tooling you want. We’ve seen that many tools do lots of tasks but as you dig into them some will be better at certain tasks than others – they won’t all be best in class in every area which may or may not be fine dependent on your needs.
Generally businesses prefer to have less tools rather than more as it reduces licensing costs, maintenance and upskilling so I’m not advising to deliberately diversify! Simply to understand your needs and accept there may be exceptions. For example:
- Maybe some data has strict compliance requirements on data residency and access controls that many products lack.
- Perhaps you have AI and ML requirements that need the state of the art in Gen AI and don’t want to wait for your vendor’s tooling to catchup.
- You need a CDP that has integrations into some of your other tooling
- Utilising a separate BI and reporting tool from another vendor may bring better visualisations or be easier for your existing analysts
Data buses
As important as the warehousing and processing is how you actually supply data into the data lake, CDP and any other sinks from the source systems. Be aware that a one size fits all data bus isn’t always a good idea. High volume, real time data where latency matters more than accuracy, will often benefit a different solution to low volume data with high accuracy needs such as regulatory reporting. It’s not a bad thing to have multiple tools or one technology configured differently for each case. For example, where volumes are massive or super low latency is needed specialist tools like Kafka could be considered but are unlikely to be suitable everywhere as they come with tradeoffs in integration ease.
Feedback loops
An area we haven’t touched on yet is using big data techniques in day to day operational flows and feedback. This could be: analysing supply chain/video pipeline/security threats in real time and acting on anomalies, creating a trending now feature or performing live segment updates of customers based on activity (with ad revenue implications).

I’ve seen it in multiple organisations where a data system and team is assembled with an aim to do offline analysis. The service contract for the software doesn’t mandate high availability because it wasn’t envisaged as customer impacting and the supporting team is Mon-Fri 9-5. Then a need arises whereby the data system is seen as the best place to do some kind of complex query or machine learning that is needed to make a customer impacting feature work where 24/7 support and service level agreements are required. The data team object because they can’t support it but there’s no other natural home for the particular calculation and everyone has a problem.
Final thoughts
We’ve had a quick look at types of data, different use cases around data and some of the technologies to support those use cases. There’s tools that can cover a lot of use cases but not all and with varying degrees of maturity and flexibility for each case.
It’s important to really understand your requirements and what you want to do with data such that you can get the maximum value out of it. Don’t just have a central data team who decide and manage everything data related. If requirements and decisions are are removed from the engineering and the business teams wanting value out of the data, you’ll end up with poor outcomes.

