
Quick update - the code in this article was used as the starting point for components in the d3fc project. It’s a bit more advanced than this article, but you might find it interesting to see what this code evolved into!
In this article I’m going to create an interactive Fibonacci fan D3 component, and show you how to add it to a chart in just 7 lines of code.
For many of you, your first question is probably…
What is a Fibonacci fan?
A Fibonacci fan looks like this:
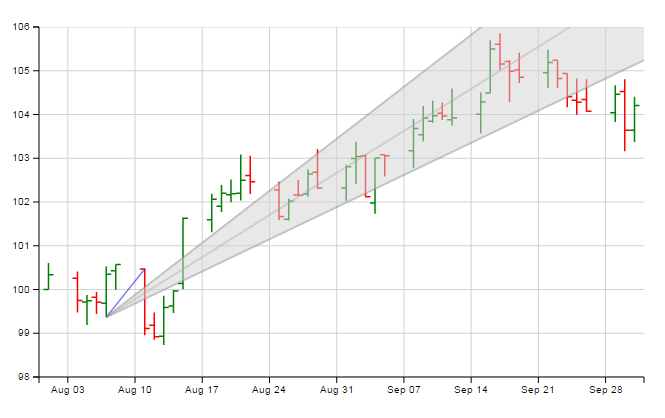
Investopedia explains how to draw a Fibonacci fan:
Fibonacci fans are created by first drawing a trendline through two points (usually the high and low in a given period), and then by dividing the vertical distance between the two points by the key Fibonacci ratios of 38.2%, 50% and 61.8%. The result of these divisions each represent a point within the vertical distance. The three 'fan' lines are then created by drawing a line from the leftmost point to each of the three representing a Fibonacci ratio.
If you want a more detailed explanation of the mathematics behind it, you can find one here.
Below you’ll see a chart, to which I’ve added my interactive Fibonacci fan component. To draw the fan:
- Select your first point by clicking on the chart; you’ll now see a blue trendline from this point to the point closest to the mouse
- Click on the chart again to select your second point; the fan lines are drawn from the first point to the edge of the chart
- Click anywhere on the chart to dismiss the fan
Have a go and see it in action.
The Fibonacci Fan Component
I tackled this project by creating a component with multiple phases, whose mouse move / click behaviour would change depending on which phase it was in.
- In phase 1, we highlight the nearest data point, much like my previous crosshairs component; a mouse click stores this point (let’s call it origin) and moves us on to phase 2
- In phase 2, we again highlight the data point nearest the mouse and draw a trend line between this and the origin point; a click stores this point (target), draws the fan lines in the right places and moves us on to phase 3
- In phase 3, we don’t react to mouse movement at all; a click hides the trend line and fan and returns us to phase 1
Here’s the code for the component - I’ve left it in one block so it’s easier to copy & paste. Underneath, we’ll go through the code and explain what’s going on.
sl.series.fibonacciFan = function () {

    var target = null,
        series = null,
        xScale = d3.time.scale(),
        yScale = d3.scale.linear();

    var circleOrigin = null,
        circleTarget = null,
        lineSource = null,
        lineA = null,
        lineB = null,
        lineC = null,
        fanArea = null;

    var phase = 1,
        locationOrigin = null,
        locationTarget = null;

    var fibonacciFan = function () {

        var root = target.append('g')
            .attr('class', 'fibonacci-fan');

        circleOrigin = root.append("circle")
            .attr('class', 'fibonacci-fan origin')
            .attr('r', 6)
            .attr('display', 'none');

        circleTarget = root.append("circle")
            .attr('class', 'fibonacci-fan target')
            .attr('r', 6)
            .attr('display', 'none');

        lineSource = root.append("line")
            .attr('class', 'fibonacci-fan source')
            .attr('display', 'none');

        lineA = root.append("line")
            .attr('class', 'fibonacci-fan a')
            .attr('display', 'none');

        lineB = root.append("line")
            .attr('class', 'fibonacci-fan b')
            .attr('display', 'none');

        lineC = root.append("line")
            .attr('class', 'fibonacci-fan c')
            .attr('display', 'none');

        fanArea = root.append("polygon")
            .attr('class', 'fibonacci-fan area')
            .attr('display', 'none');
    };

    function mousemove() {

        switch (phase) {
            case 1: {
                locationOrigin = findLocation();
                fibonacciFan.update();
                circleOrigin.attr('display', 'inherit');
                break;
            }
            case 2: {
                locationTarget = findLocation();
                fibonacciFan.update();
                circleTarget.attr('display', 'inherit');
                lineSource.attr('display', 'inherit');
                break;
            }
            case 3: {
                break;
            }
        }
    }

    function mouseclick() {

        switch (phase) {
            case 1: {

                phase = 2;
                break;
            }
            case 2: {

                setFan();

                phase = 3;
                break;
            }
            case 3: {

                clearFan();

                phase = 1;
                break;
            }
        }
    }

    function findLocation() {

        var mouse = d3.mouse(target[0][0]),
            xMouse = xScale.invert(mouse[0]),
            yMouse = yScale.invert(mouse[1]),
            point = findPoint(xMouse);

        if (point !== null) {

            var field = findField(yMouse, point);

            if (field !== null) {

                return { point: point, field: field }
            }
        }

        return null;
    }

    function findPoint(xTarget) {

        var nearest = null,
            dx = Number.MAX_VALUE;

        series.forEach(function(data) {

            var xDiff = Math.abs(xTarget.getTime() - data.date.getTime());

            if (xDiff < dx) {
                dx = xDiff;
                nearest = data;
            }
        });

        return nearest;
    }

    function findField(yTarget, data) {

        var field = null;

        var minDiff = Number.MAX_VALUE;
        for (var property in data) {

            if (!data.hasOwnProperty(property) || (property === 'date')) {
                continue;
            }

            var dy = Math.abs(yTarget - data[property]);
            if (dy <= minDiff) {
                minDiff = dy;
                field = property;
            }
        }

        return field;
    }

    function setFan() {

        if (xScale(locationOrigin.point.date) > xScale(locationTarget.point.date)) {
            var tmp = locationOrigin;
            locationOrigin = locationTarget;
            locationTarget = tmp;
        }

        var originX = xScale(locationOrigin.point.date),
            originY = yScale(locationOrigin.point[locationOrigin.field]),
            targetX = xScale(locationTarget.point.date),
            targetY = yScale(locationTarget.point[locationTarget.field]),
            finalX = xScale.range()[1],
            finalY = calculateY(originX, originY, targetX, targetY, finalX);

        setFanLines(originX, originY, finalX, finalY.source, finalY.source, finalY.source);

        lineA.attr('display', 'inherit');
        lineB.attr('display', 'inherit');
        lineC.attr('display', 'inherit');
        fanArea.attr('display', 'inherit');

        var pointsFinal = originX + ',' + originY
            + ' ' + finalX + ',' + finalY.a
            + ' ' + finalX + ',' + finalY.c;

        lineA.transition()
            .attr('y2', finalY.a);
        lineB.transition()
            .attr('y2', finalY.b);
        lineC.transition()
            .attr('y2', finalY.c);
        fanArea.transition()
            .attr('points', pointsFinal);

        circleOrigin.attr('display', 'none');
        circleTarget.attr('display', 'none');
    }

    function clearFan() {

        locationOrigin = null;
        locationTarget = null;

        circleOrigin.attr('display', 'none');
        circleTarget.attr('display', 'none');
        lineSource.attr('display', 'none');
        lineA.attr('display', 'none');
        lineB.attr('display', 'none');
        lineC.attr('display', 'none');
        fanArea.attr('display', 'none');
    }

    function calculateY(originX, originY, targetX, targetY, finalX) {

        var gradient = (targetY - originY) / (targetX - originX),
            ySource = (gradient * (finalX - originX)) + originY,
            yA = ((gradient * 0.618) * (finalX - originX)) + originY,
            yB = ((gradient * 0.500) * (finalX - originX)) + originY,
            yC = ((gradient * 0.382) * (finalX - originX)) + originY;

        return {source: ySource, a: yA, b: yB, c: yC};
    }

    function setFanLines(originX, originY, finalX, finalYa, finalYb, finalYc) {

        var points = originX + ',' + originY
            + ' ' + finalX + ',' + finalYa
            + ' ' + finalX + ',' + finalYc;

        lineA.attr('x1', originX)
            .attr('y1', originY)
            .attr('x2', finalX)
            .attr('y2', finalYa);
        lineB.attr('x1', originX)
            .attr('y1', originY)
            .attr('x2', finalX)
            .attr('y2', finalYb);
        lineC.attr('x1', originX)
            .attr('y1', originY)
            .attr('x2', finalX)
            .attr('y2', finalYc);
        fanArea.attr('points', points);
    }

    fibonacciFan.update = function () {

        var originX = xScale(locationOrigin.point.date),
            originY = yScale(locationOrigin.point[locationOrigin.field]);

        circleOrigin.attr('cx', originX)
            .attr('cy', originY);
        lineSource.attr('x1', originX)
            .attr('y1', originY);

        if (locationTarget) {

            var targetX = xScale(locationTarget.point.date),
                targetY = yScale(locationTarget.point[locationTarget.field]);

            circleTarget.attr('cx', targetX)
                .attr('cy', targetY);
            lineSource.attr('x1', originX)
                .attr('y1', originY)
                .attr('x2', targetX)
                .attr('y2', targetY);

            if (phase === 3) {

                var finalX = xScale.range()[1],
                    finalY = calculateY(originX, originY, targetX, targetY, finalX);

                setFanLines(originX, originY, finalX, finalY.a, finalY.b, finalY.c)
            }
        }
    };

    fibonacciFan.target = function (value) {
        if (!arguments.length) {
            return target;
        }

        if (target) {

            target.on('mousemove.fibonacci-fan', null);
            target.on('click.fibonacci-fan', null);
        }

        target = value;

        target.on('mousemove.fibonacci-fan', mousemove);
        target.on('click.fibonacci-fan', mouseclick);

        return fibonacciFan;
    };

    fibonacciFan.series = function (value) {
        if (!arguments.length) {
            return series;
        }
        series = value;
        return fibonacciFan;
    };

    fibonacciFan.xScale = function (value) {
        if (!arguments.length) {
            return xScale;
        }
        xScale = value;
        return fibonacciFan;
    };

    fibonacciFan.yScale = function (value) {
        if (!arguments.length) {
            return yScale;
        }
        yScale = value;
        return fibonacciFan;
    };

    return fibonacciFan;
};
Let’s go through this, bit by bit.
Declarations
At the top of the file we have our field declarations:
- First, the fields for which we have property accessors:
target(the element to which we’ll attach our event handlers),series(the data series we’re going to track), and thexScaleandyScalefields - Then a set of fields which will hold the various SVG elements we need to draw the fan
- Finally, some internal fields:
phase(which obviously stores the phase the component is in);locationOriginandlocationTarget(which will hold the location of the points at either end of the trend line)
Component function
The component function is pretty trivial for this component - all we’re doing is initialising each of our SVG elements in turn, giving each a unique CSS class and making sure they’re all set to display: none initially.
Event handlers
We have two event handlers (which are set in the target() property accessor, see below) - mouseMove() and mouseClick().
- In
mouseMove(), we set ourlocationOrigin(in phase 1) andlocationTarget(in phase 2) fields, and then callupdate()to set the co-ordinates of the trend line (lineSource) and circle (circleOrigin/circleTarget) SVG elements. In phase 3 we don’t need to respond to mouse movement. - In
mouseClick(), we call thesetFan()function if we’re in phase 2, or theclearFan()function if we’re in phase 3. Regardless of which phase we’re in, we always advance to the next phase.
Helper functions
The two functions that do all the work for this component are setFan() and clearFan().
setFan()is the big one, but when we break it down, it’s not doing anything magic. First we do a bit of sanity checking - is our target point further to the right than our origin point? If not, switch them round before doing anything else. Then we callcalculateY()to calculate the gradient of the trend line, and using this we calculate the Y co-ordinate of the line that would exist if we continued this line all the way to the rightmost edge of the chart, as well as the Y co-ordinates of the fan lines (we can calculate these by using the Fibonacci ratios of 0.618, 0.5 and 0.382). Rather than drawing the fan lines in the right place immediately, we add a little visual flair by first drawing them at the highest point (usingsetFanLines()), then using ad3.transitionto move them down to their correct locations. We then hide the circle SVG elements.clearFan()is pretty simple - we reset ourlocationOriginandlocationTargetfields to null, and setdisplay: noneon all our SVG elements.
We have three functions which help us to find the data value closest to the mouse pointer:
findLocation(): This function finds the mouse co-ordinates and converts them to values on our X and Y scales, then usesfindPoint()andfindField()to return the data point and field namefindPoint(): Given a date, this function iterates through the data points to find the point closest to this date.findField(): Given a value and a data point, this function iterates through the fields on the data point to find the field with the closest value.
The component also provides a public function, update(), which recalculates the position of each of the SVG elements. I’ve included this because it’s required if the scales change (e.g. because of panning / zooming on the chart) - if you don’t call update(), the fan will stay in the same place while the chart moves around it.
Property accessors
Nothing unusual here, just get/set accessors for the fields noted above - with the exception of target, for which we need to set up our event handlers.
Styling
Here’s the CSS that I’ve used - nothing unusual here. Blue for the circles and trend line, grey for the fan lines (with the middle one slightly faded), and a light grey background for the fan.
.chart line.fibonacci-fan {
    fill: none;
    stroke: grey;
    stroke-width: 2;
    stroke-opacity: 0.5;
}

.chart line.fibonacci-fan.source {
    stroke: blue;
    stroke-width: 1.5;
}

.chart line.fibonacci-fan.b {
    stroke-opacity: 0.4;
}

.chart circle.fibonacci-fan {
    fill: none;
    stroke: blue;
    stroke-width: 1;
    stroke-opacity: 0.5;
}

.chart polygon.fibonacci-fan.area {
    fill: lightgrey;
    fill-opacity: 0.5;
    stroke-width: 0;
}
Adding the fan to the chart
Now that we’ve created the component, the final step is to add the component to a chart. As usual, I’m starting with the OHLC chart that Tom developed in his article on OHLC and candlestick components.
As with my previous article, I’m adding an invisible overlay onto the chart, so that we get mousemove events fired when the mouse moves anywhere on the chart area.
We initialise the Fibonacci fan component, providing values for all the properties it needs, then we add the component to the plot area, as follows:
var fibonacci = sl.series.fibonacciFan()
    .target(plotArea)
    .series(data)
    .xScale(xScale)
    .yScale(yScale);

plotArea.call(fibonacci);
And with that, we’re done! We’ve created the interactive chart you see above.
Enhancements
Perhaps a useful enhancement for this component would be to add a crosshairs element so that the user has some extra feedback about the data points they’re about to click on. We’d probably want to set it up such that the crosshairs would only be visible when selecting points, and hidden when we’re displaying the fan elements.
Conclusion
We now have a D3 Fibonacci fan component which can be added to a chart with only 6 lines of code. It’s an interactive component, using mouse move / click events to move between the different phases of placing the first point, placing the second point, and viewing the fan. We also use transitions to make the appearance of the fan a little more visually appealing.