This blog looks at how CSS flexbox layout can be applied to SVG in order to simplify the task of constructing charts with D3. This approach has been made possible by the JavaScript flexbox implementation that Facebook recently open sourced to support ReactJS Native.
Here’s a quick example, where the layout of a chart is defined using SVG and flexbox via the layout-css attributes:
<svg id="chart" style="height: 100%; width: 100%; margin: 10px">
  <g layout-css="height: 30; justifyContent: center; flexDirection: row">
    <text layout-css="width: 0;" text-anchor="middle" dy="1em" font-size="20">
      Awesome Chart Layout Example!</text>
  </g>
  <g layout-css="flex: 1; flexDirection: row; marginLeft: 20">
    <g layout-css="flex: 1;" class="plotArea"></g>
    <g layout-css="width: 50;" class="axis right"></g>
    <g layout-css="width: 30; justifyContent: center;">
      <g layout-css="height: 0;">
        <text transform="rotate(90)">Price</text>
      </g>
    </g>
  </g>
  <g layout-css="height: 30; flexDirection: row">
    <g layout-css="flex: 1; marginRight: 80; marginLeft: 20" class="axis bottom">
    </g>
  </g>
  <g layout-css="height: 30; justifyContent: center; flexDirection: row">
    <text layout-css="width: 0; marginRight: 80" text-anchor="middle" dy="1em">
      Date</text>
  </g>
</svg>
And here’s a chart that makes use of the above layout:
Introduction
If you’ve ever wanted to plot a chart or create a visualisation, you will no doubt have come across D3. The power and versatility of this framework has resulted in it becoming one of the most popular repositories on GitHub.
D3 excels at transforming data into SVG or HTML elements, allowing charts to be constructed with very little code. However, D3 does little to help with the more mundane task of layout; the positioning of axes, labels, the legend etc …
Mike Bostock (D3’s creator) has published a simple Margin Convention which he uses in his own examples. As you can see from the code below the simple task of applying a margin around the chart requires some fiddly maths:
var margin = {top: 20, right: 10, bottom: 20, left: 10};

var width = 960 - margin.left - margin.right,
    height = 500 - margin.top - margin.bottom;

var svg = d3.select("body").append("svg")
    .attr("width", width + margin.left + margin.right)
    .attr("height", height + margin.top + margin.bottom)
  .append("g")
    .attr("transform", "translate(" + margin.left + "," + margin.top + ")");
Once you start adding axes, titles or a legend things really start to get out of hand …
To be fair, this isn’t really a fault of D3, the problem of layout simply isn’t within the remit of this library.
With SVG elements are positioned using a simple coordinate system, which also doesn’t help us much when trying to construct a suitable layout.
Whilst battling with this problem, my colleague Chris Price came up with a great idea, why not apply the flexbox layout algorithm to SVG? HTML and CSS have a number of different techniques for constructing layouts - if one of these could be applied to SVG it would make it possible to construct a chart without all of the manual computation seen above.
Just a couple of days after Chris suggested this approach I was watching the Facebook ReactJS Keynote, where they unveiled React Native. This framework allows you to write iOS and Android apps using ReactJS. During the development of this framework they had found the iOS constraints-based layout system to be quite cumbersome so replaced it with a flexbox implementation written in JavaScript. Their re-implementation of flexbox is open sourced as a separate project.
Perfect!
Applying Flexbox to SVG
The interface for Facebook’s css-layout couldn’t be simpler, given a tree of nodes with associated CSS attributes, you invoke computeLayout:
computeLayout(
  {style: {padding: 50}, children: [
    {style: {padding: 10, alignSelf: 'stretch'}}
  ]}
);
The resultant layout is computed after which each node is given a layout property that describes its width, height and location with respect to the parent node:
{width: 120, height: 120, top: 0, left: 0, children: [
  {width: 20, height: 20, top: 50, left: 50}
]}
Applying this technique to SVG is as simple as associating a style with each SVG element. This can be done by adding a custom attribute, layout-css:
<svg layout-css="paddingLeft: 10">
  <g layout-css="flex: 1; flexDirection: row;">
    <g layout-css="flex: 1;"></g>
    <g layout-css="width: 50;"></g>
    <g layout-css="width: 30; justifyContent: center;"></g>
  </g>
</svg>
The following code constructs a suitable node-tree from the above SVG:
// creates the structure required by the layout engine
function createNodes(el) {
  function getChildNodes() {
    var children = [];
    for (var i = 0; i < el.childNodes.length; i++) {
      var child = el.childNodes[i];
      if (child.nodeType === 1) {
        if (child.getAttribute('layout-css')) {
          children.push(createNodes(child));
        }
      }
    }
    return children;
  }
  return {
    style: parseStyle(el.getAttribute('layout-css')),
    children: getChildNodes(el),
    element: el,
    layout: {
      width: undefined, height: undefined,
      top: 0, left: 0
    }
  };
}
I have omitted the parseStyle function which parses the layout-css property constructing a JavaScript object.
Once the node tree has been constructed and the layout computed, all that remains is to apply this layout to the SVG. The top and left layout properties are applied as a transform, whereas the height and width are written to layout-height and layout-width attributes respectively. The reason for this is that SVG group elements (g) have an origin but do not have a width or height. In order for a child element to occupy the rectangle defined by the layout mechanism, they need some way to obtain the computed bounds.
The following puts it all together as a function that can be called on a D3 selection
var layout = function(selection) {
  selection.each(function(data) {
    // compute the width and height of the SVG element
    var style = getComputedStyle(this);
    var width = parseFloat(style.width) - parseFloat(style.paddingLeft) -
                          parseFloat(style.paddingRight);
    var height = parseFloat(style.height) - parseFloat(style.paddingTop) -
                          parseFloat(style.paddingBottom);

    // create the layout nodes
    var layoutNodes = createNodes(this);
    // set the width / height of the root
    layoutNodes.style.width = width;
    layoutNodes.style.height = height;

    // use the Facebook CSS goodness
    computeLayout(layoutNodes);

    // apply the resultant layout
    applyLayout(layoutNodes);
  });
};
Applying flexbox layout to a selection is now as simple as the following:
d3.select('#layout-test');
  .call(layout)
With the simple SVG example above, the layout mechanism writes the required transforms, widths and heights as follows:
<svg id="layout-test" layout-css="paddingLeft: 10" layout-width="300"
     layout-height="150" transform="translate(0, 0)">
  <g layout-css="flex: 1; flexDirection: row;" layout-width="290"
     layout-height="150" transform="translate(10, 0)">
    <g layout-css="flex: 1;" layout-width="210"
       layout-height="150" transform="translate(0, 0)"></g>
    <g layout-css="width: 50;" layout-width="50"
       layout-height="150" transform="translate(210, 0)"></g>
    <g layout-css="width: 30; justifyContent: center;"
       layout-width="30" layout-height="150" transform="translate(260, 0)"></g>
  </g>
</svg>
Creating a chart layout
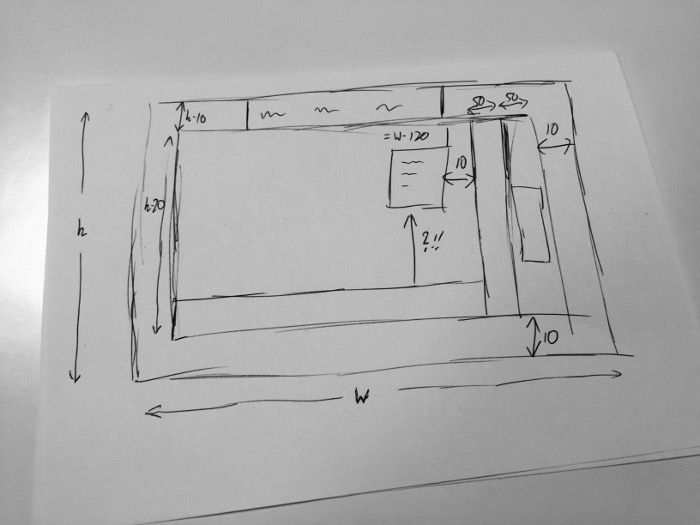
Here’s a more complex example that shows how this technique can be applied to construct a suitable layout for a chart with a title, axes and legend:
<svg id="layout-test"
     style="width: 600px; height: 350px; margin: 10px; background: yellow"
     layout-css="paddingLeft: 10">
  <g layout-css="height: 30; justifyContent: center; flexDirection: row;">
  </g>
  <g layout-css="flex: 1; flexDirection: row;">
    <g layout-css="flex: 1; flexDirection: row; justifyContent: flex-end;">
      <g layout-css="width: 100; height: 100; margin: 10"></g>
    </g>
    <g layout-css="width: 50;"></g>
    <g layout-css="width: 30; justifyContent: center;"></g>
  </g>
  <g layout-css="height: 30; flexDirection: row">
    <g layout-css="flex: 1; marginRight: 80;"></g>
  </g>
  <g layout-css="height: 30; flexDirection: row">
  </g>
</svg>
The following code applies the flexbox layout algorithm, then adds a rectangle to each of the containers that have been constructed in order to help visualise the results:
d3.select('#layout-test').call(layout);

var c10 = d3.scale.category10();

d3.selectAll("g").filter(function(d) {
    return this.childElementCount === 0;
  })
  .append('rect').attr('fill', function(d, i) { return c10(i); })
  .attr('width', function() {
    return this.parentNode.getAttribute('layout-width')}
  )
  .attr('height', function() {
    return this.parentNode.getAttribute('layout-height')}
  );
This results in the following layout:
Computing the above armed with nothing more than the ‘margin convention’ would be quite a painful process!
Summary
It was a great coincidence that the ReactJS Native development resulted in the open-sourcing of exactly the component I needed for applying flexbox to SVG. If you are interested in using this code, you can find it within the D3FC repository. This is a project with a wider goal of making it easier to construct complex financial charts using D3. Our aim is to construct components that enhance D3 rather than wrap it (which would take most of its power away).
Anyhow, more on D3FC later …
Regards, Colin E.