
A Data Platform
Systems generate a lot of machine data from activity such as events and logs. The idea of Splunk is to be a data platform that captures and indexes all this data so that it can be retrieved and interpreted in a meaningful way. Since Splunk is intended to index massive amounts of machine data, it has a large scope of use cases. A data platform could give insight into many aspects of a system, including: application performance, security, hardware monitoring, sales, user metrics, or reporting and audits.
In this blog post I want to give an introduction to Splunk. I will cover how we can use it to search and interpret data, generate reports and dashboards, as well as pointing out features that have been very helpful for me as a developer. Disclaimer: I’m not at all a Splunk expert! That said, even with a rudimentary understanding I have found tremendous value in incorporating the use of Splunk into my daily workflow. My experience is mainly with Splunk, but the approaches I cover in this post should be applicable to alternative solutions, such as the ELK stack.
The Splunk Architecture
A Splunk system consists of forwarders, indexers, and search heads.
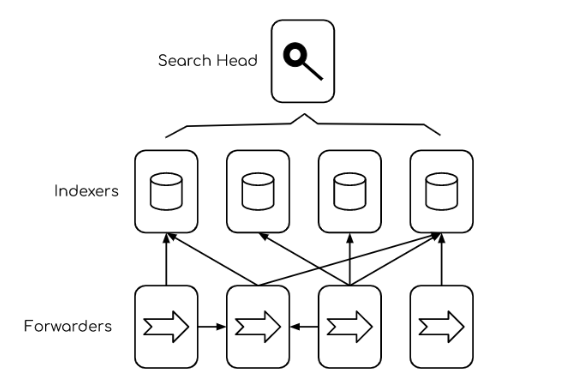
- A forwarder is an instance that sends data to an indexer or another forwarder.
- An indexer stores and manages the data.
- A search head distributes search requests to indexers and merges the results for the user.
Splunk can acquire data that is sourced from programs, or manually uploaded files. Data is decoupled from the applications that produce it and it is centralised in a distributed system. Users can access Splunk via the web browser and roles can be assigned to control access.
This is a very simple overview of the Splunk architecture. I want to focus on what you could do with Splunk over the administrative side. You could set up Splunk manually with Splunk Enterprise, or use their managed solution Splunk Cloud Platform. For this blog post, I have set up a free edition of Splunk Enterprise locally.
Searching with Splunk
As a developer, the type of machine data I interact with most will naturally be logs output by systems. Splunk comes with the search app by default for querying events. You can also implement or install custom apps.
I have set up Splunk locally with some sample data from the official search tutorial.
A benefit of using a Splunk deployment is that I don’t have to worry about finding where my data is stored once an application is set up to forward data to the indexers. If a data platform is designed to index any kind of data, then my logs should be in there somewhere.
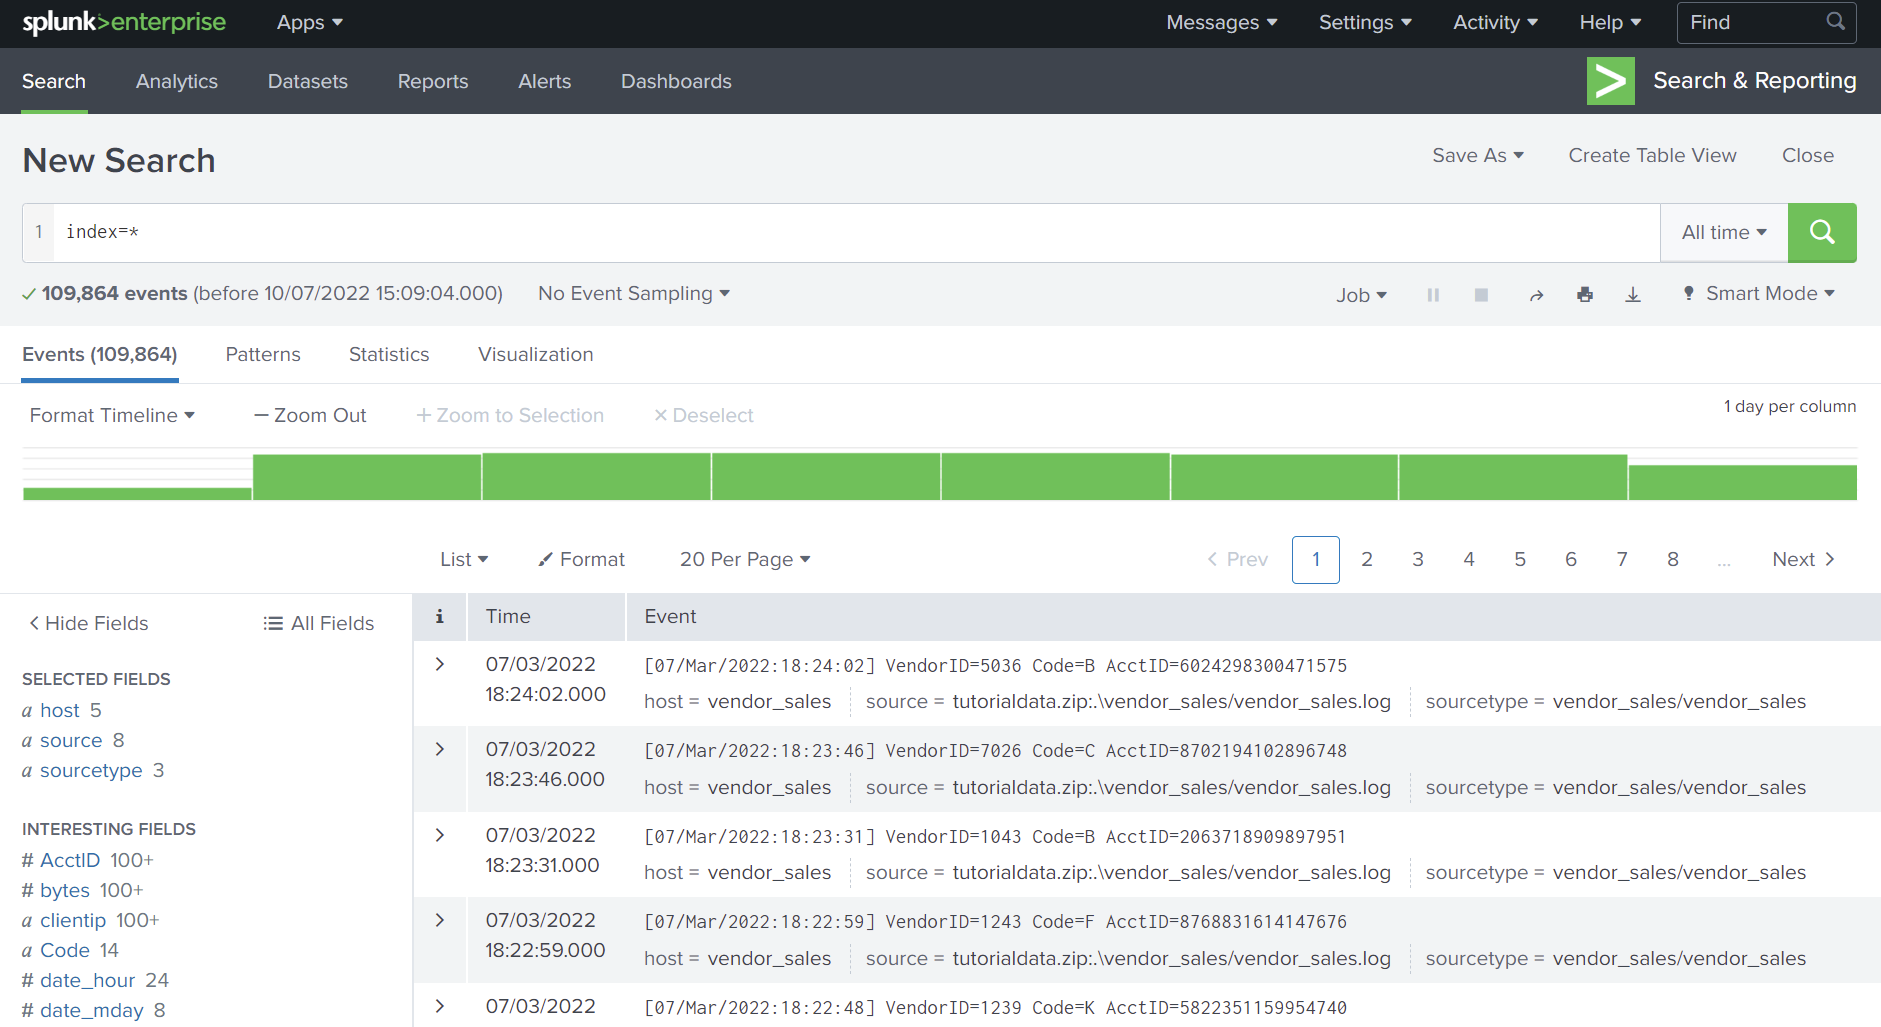
Queries are made using Splunk’s Search Processing Language (SPL).
In the figure above I used the query index=* which will match the index field to a wildcard and set the time window to ‘all time’. This retrieves every event because data in Splunk is stored in the indexes.
It is good practice to keep our queries concise, otherwise the search could take a long time to run. We can reduce the lookup time by choosing a smaller time frame on the left or limiting the number of results.
You can reduce the time searching takes by:
- Narrowing the time window
- Filtering with fields
- Limiting the number of results
See more about quick tips for optimisation from Splunk.
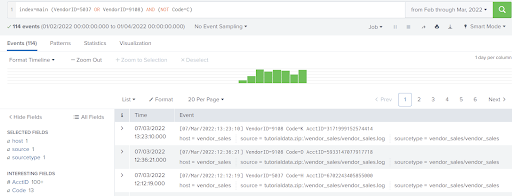
Suppose that I wanted to search for events related to vendor sales for only account id ‘6024298300471575’ in March 2022, I could set the time window and run the following query string: ~~~ index=main sourcetype=vendor_sales/vendor_sales AcctID=6024298300471575 ~~~
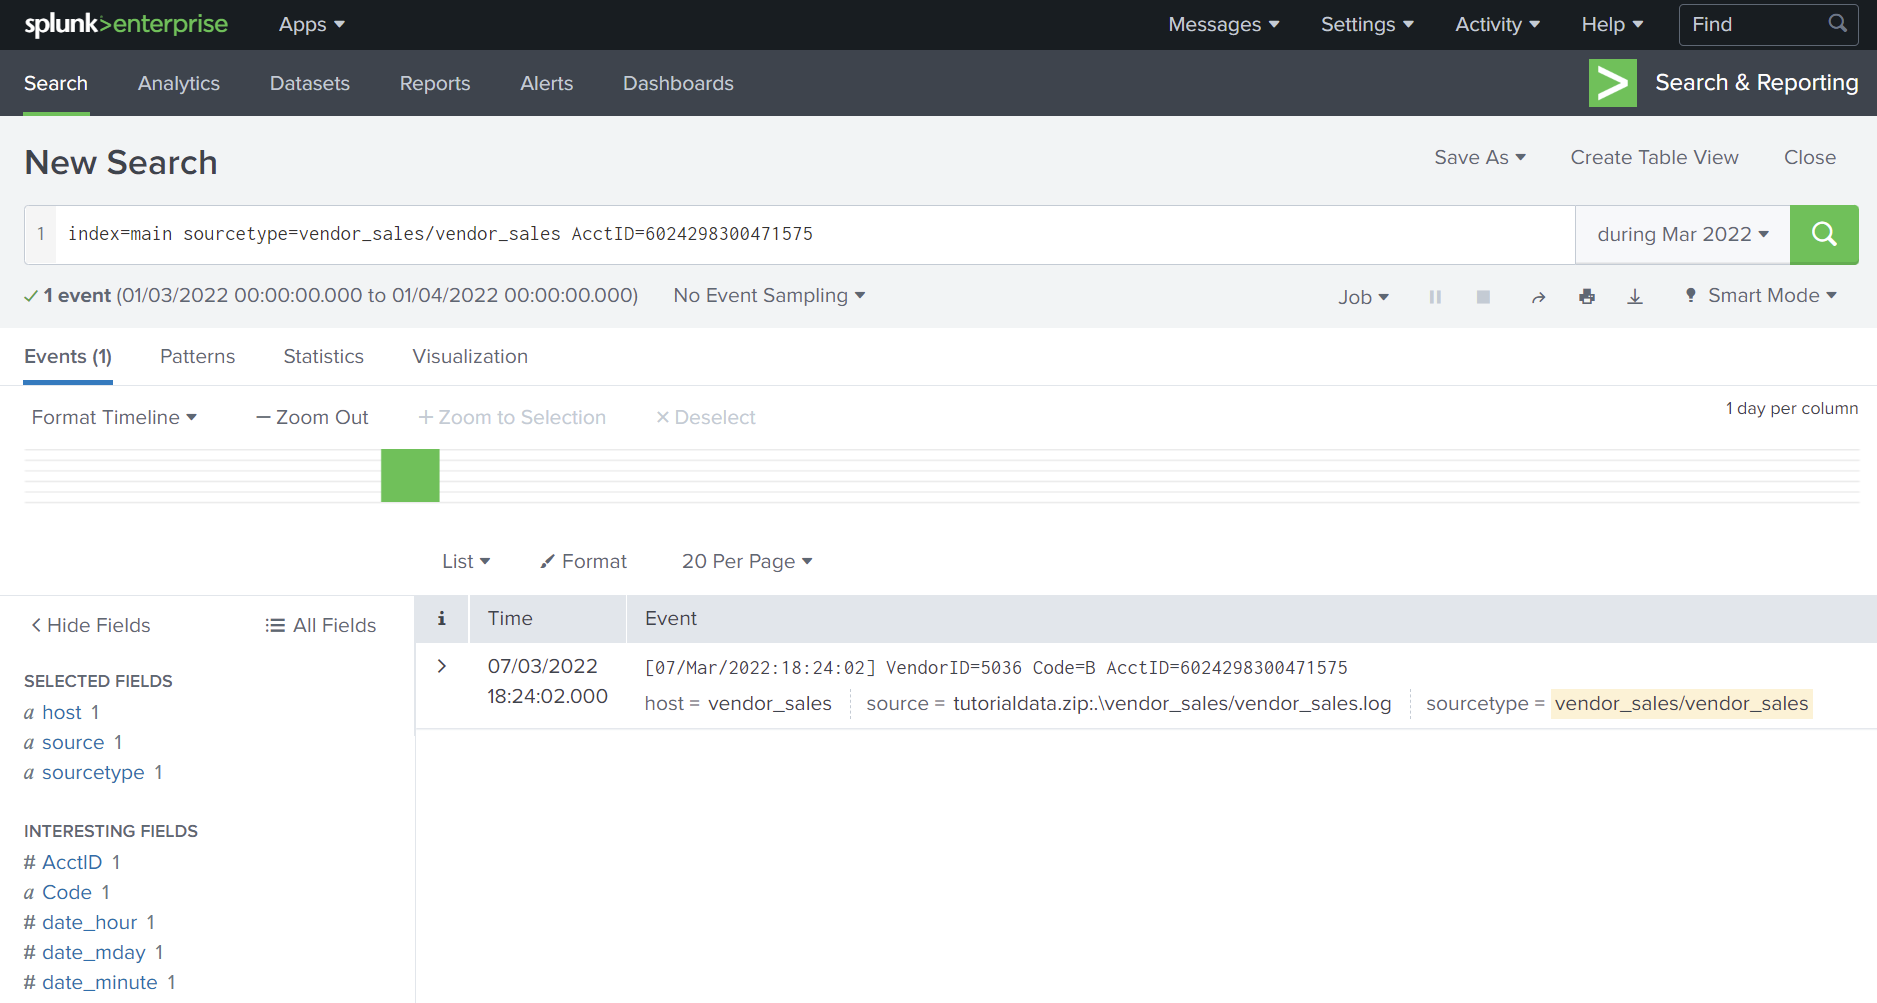
Although this example uses the ‘main’ index, it is better to use split indices by category of the data. This prevents bloating of a single index and provides an efficient way to filter data when performing queries, searching only for the indexes that are relevant.
Now let’s say I was interested in how many failed attempts to log on occurred during the first seven days of March in my data. I happen to know that the log has the format:
Failed password for <USER> <SYSTEM> from <IP> port <PORT> <PROTOCOL>
This might be from seeing the system’s code or through looking at the logs.
I can query for the substring to retrieve all events that contain Failed password for using:
index=main "*failed password for*"
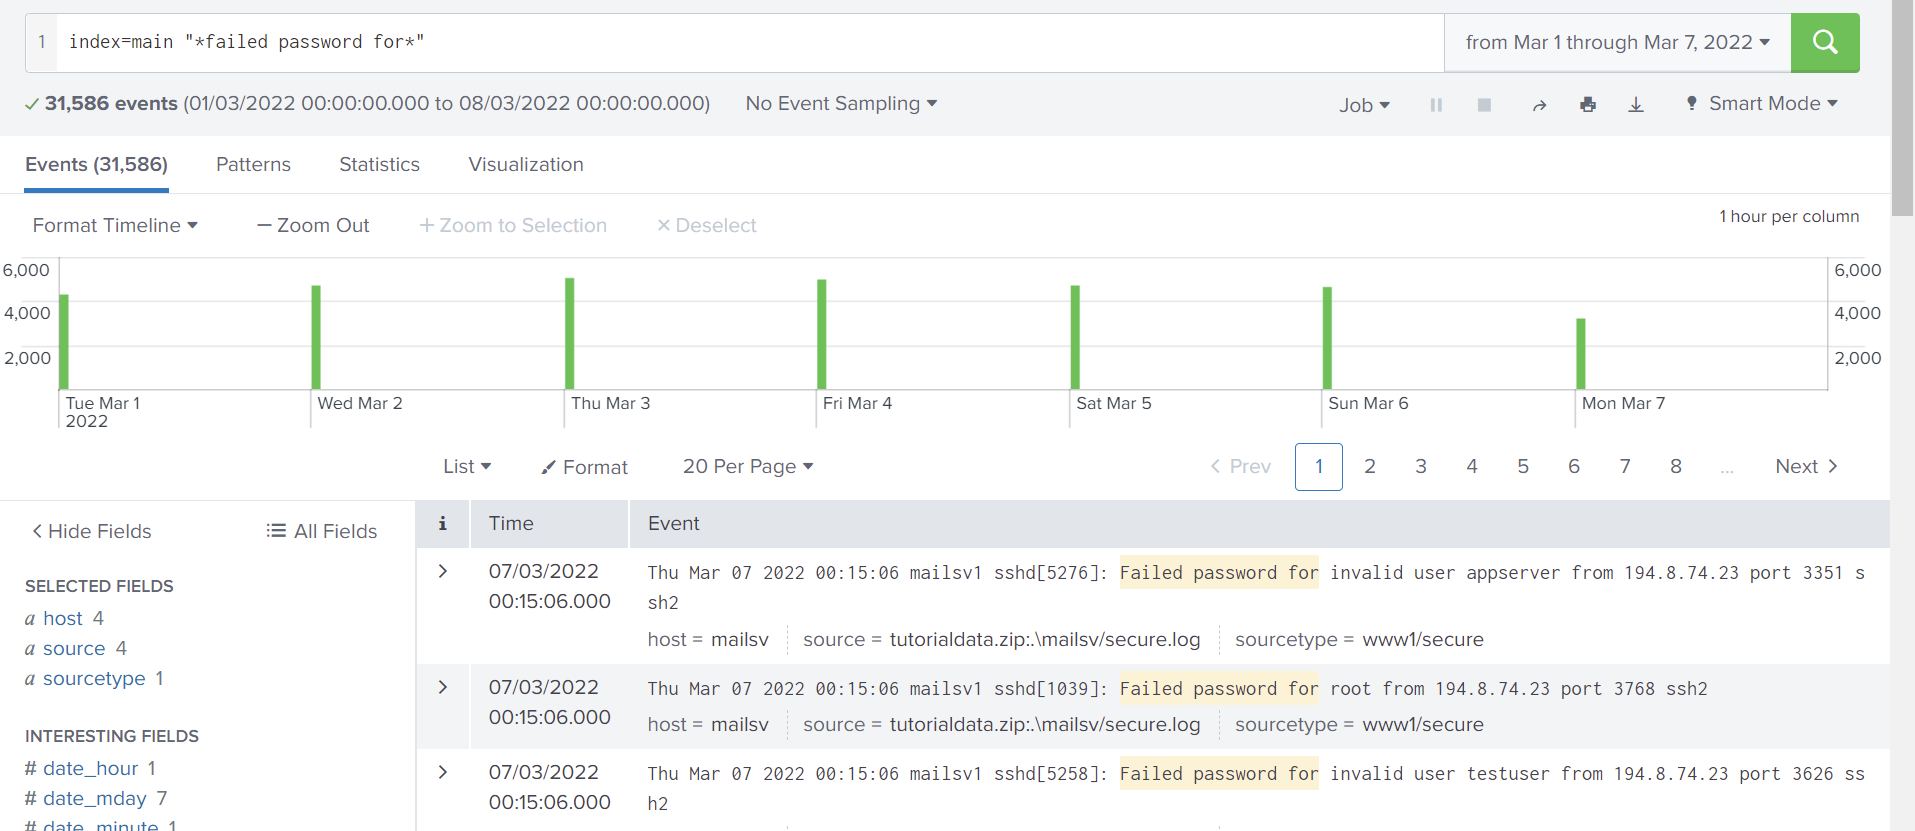
There were 31,586 events during that period. I can also see how many events occurred by the hour on the timeline just below the query. We can see that these events only occurred during the first hour of each day.
Searching also supports boolean operations such as AND, OR, XOR, NOT.
See more about predicate expressions.
It is quite common for API requests to include an X-Request-ID or X-Correlation-ID header. These headers are set to keep track of where the associated events originate from. For example, after I find a particular log of interest, I can identify the X-Request-ID to view the entire flow. This could be useful in following the execution of a system, including downstream interactions between different services.
I also find it incredibly useful to attach the Splunk query to any issue tracking ticket as evidence. It can show that the feature is operational and acts as a reference if the implementation needs revisiting in the future.
Fields and statistics
At index time, the default fields are populated. These are fields such as host, source, sourcetype, _time, and _raw.
At search time, Splunk automatically detects key-value pair fields and extracts them.
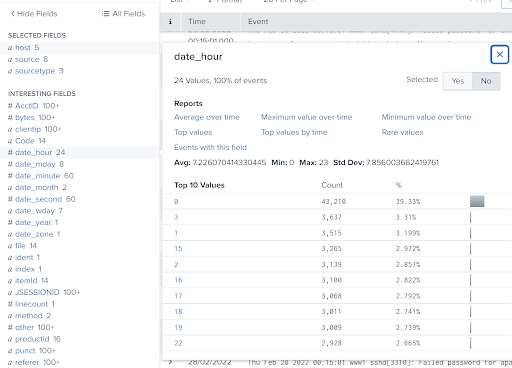
When selecting a field from the sidebar, you can see a list of the most frequent values for that field and options to generate basic reports for that field.
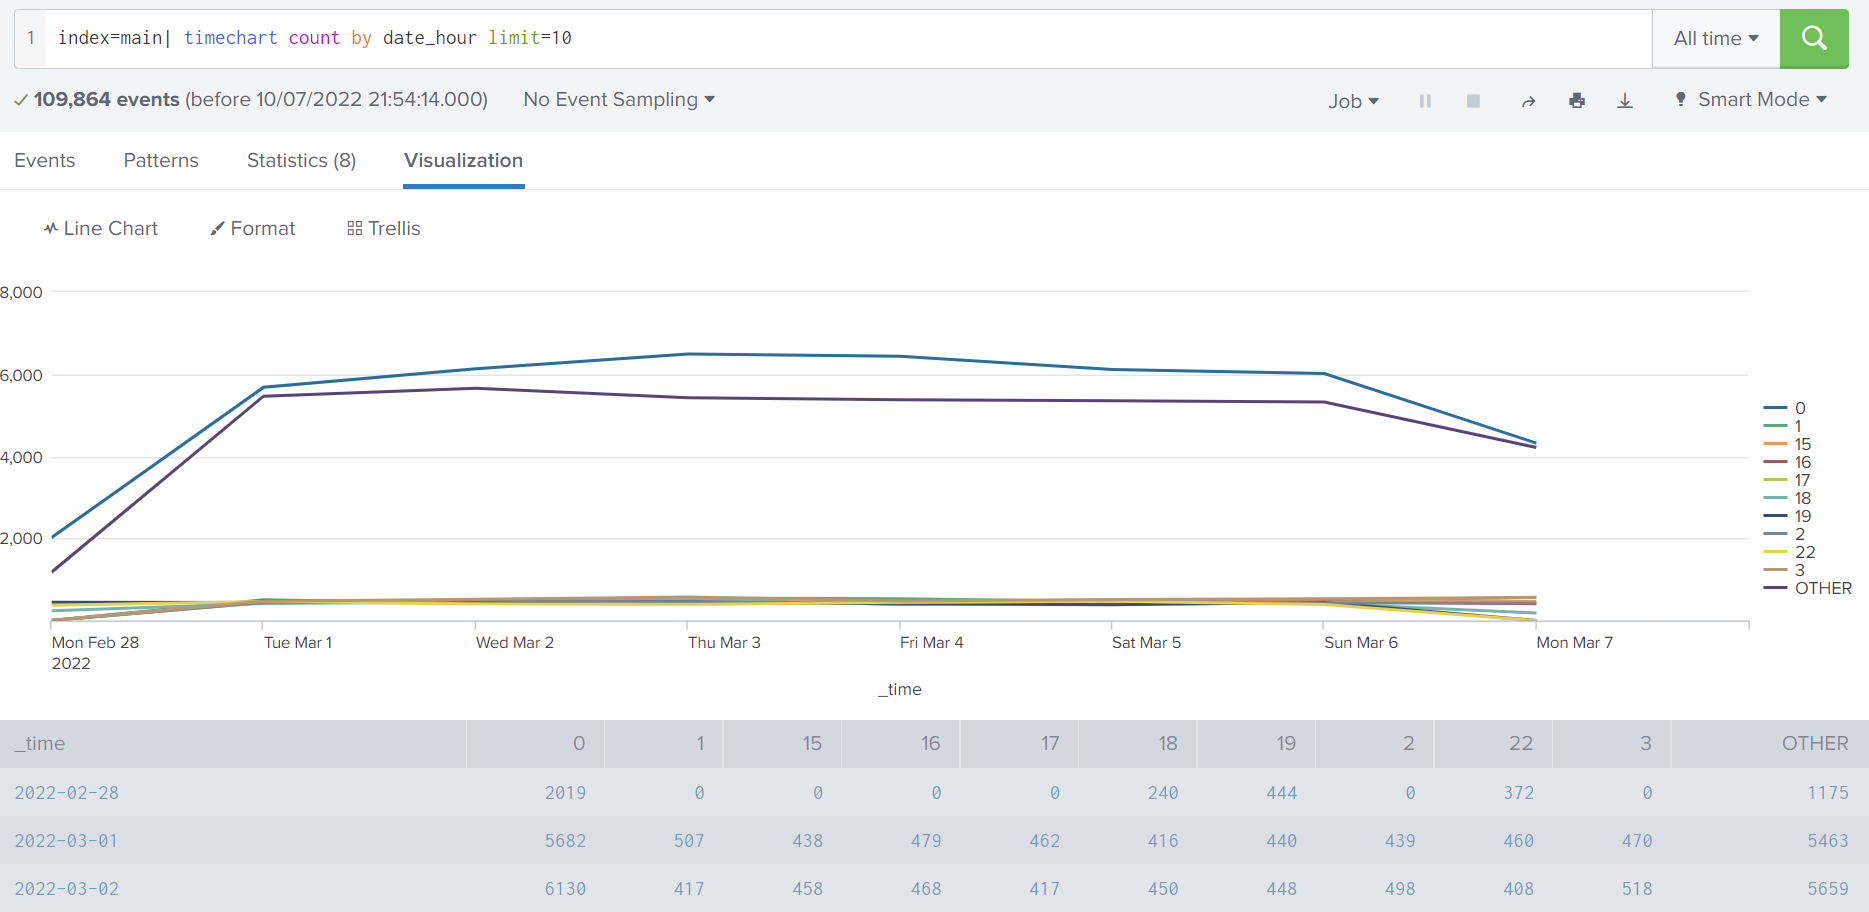
For example, selecting ‘Top values by time’ for the field ‘date_hour’ would generate a report that gives us an indication of what the busy hours are based on the number of events generated.
SPL Commands
SPL (Search Processing Language) has six broad types of commands:
- Distributable streaming
- Centralised streaming
- Transforming
- Generating
- Orchestrating
- Dataset processing
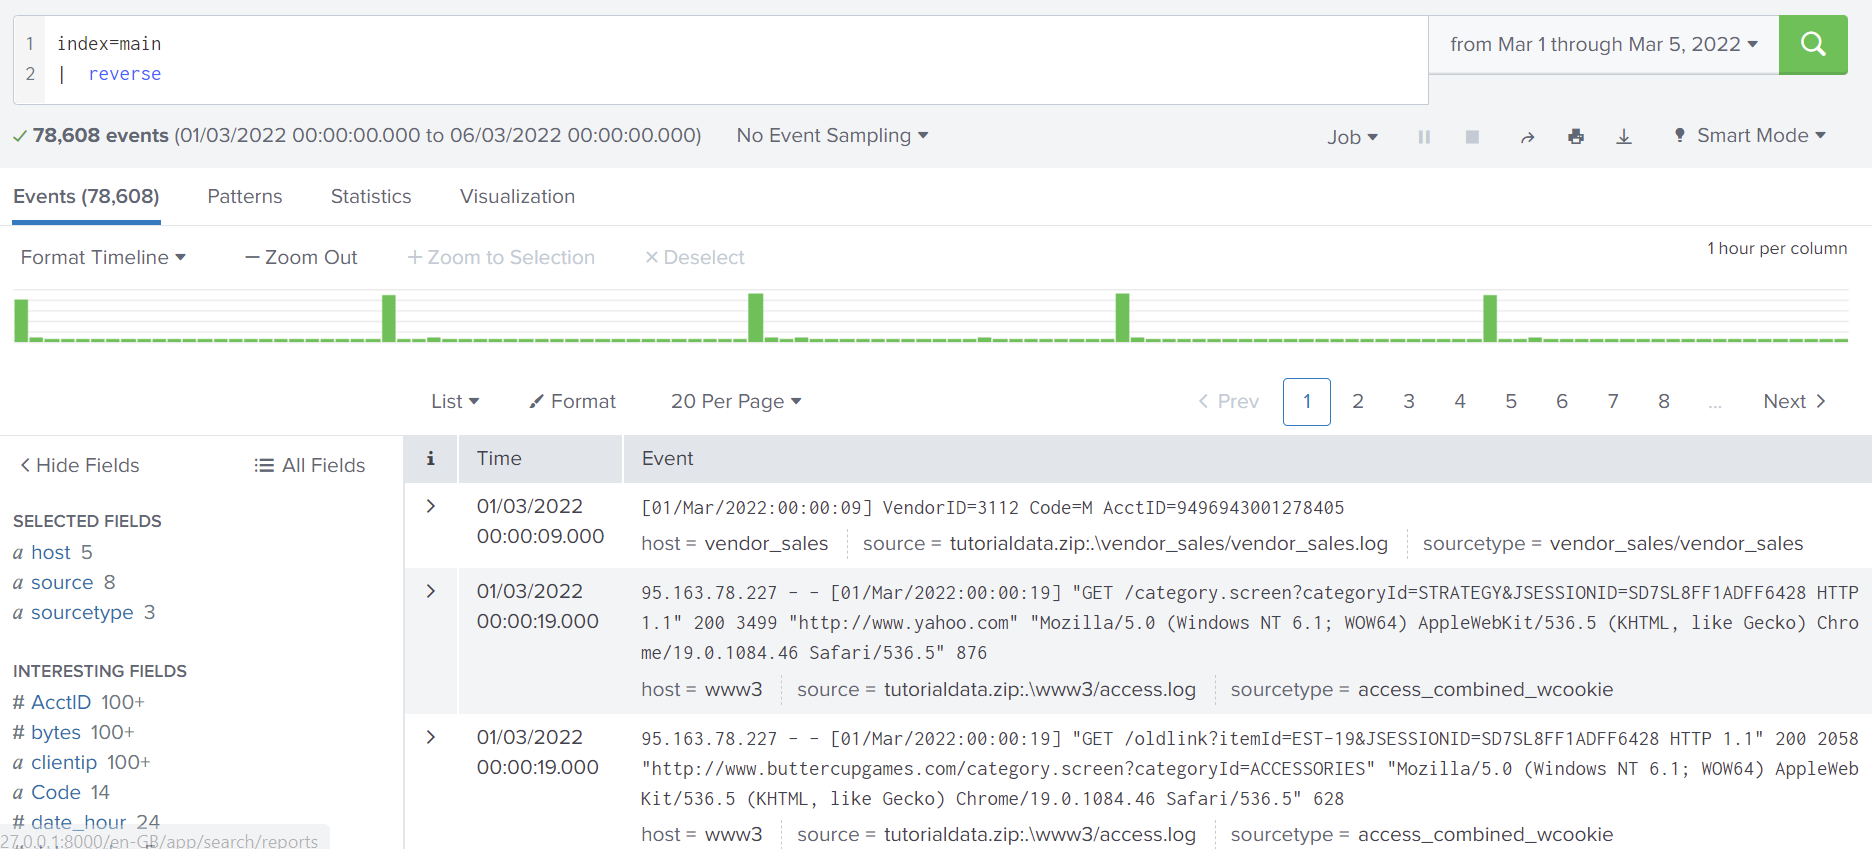
A simple command to start with would be ‘reverse’. Splunk events are presented in reverse-chronological order by default. If I piped a query to ‘reverse’, then the events that happened first would be shown at the top.
index=main | reverse
Extracting Fields with Rex
Sometimes you may want to interpret a predictable part of an event as a field. If this was not set up before, you can create a temporary field with the ‘rex’ command.
Let’s take the ‘failed password’ events from earlier. When the user is invalid, the username is logged after ‘Failed password for invalid user ‘.
Here is an example:
Thu Mar 07 2022 00:15:06 mailsv1 sshd[5258]: Failed password for invalid user testuser from 194.8.74.23 port 3626 ssh2
This username is not automatically extracted by Splunk at search time because it is not a key-pair value.
Let us have a look at the rex command to extract it:
index=main "*Failed password for invalid user*"
|  rex field=_raw "Failed password for invalid user (?<username>[^\s]*)"
We first search for events that have the substring *Failed password for invalid user*.
I use the rex command on the _raw field of the results. The _raw field is the raw text of the event. A regular expression is used to match the predictable part of the log output and extract the new field. The extraction is defined in the parenthesis (?<username>[^\s]*).
We specified the new field name to be ‘username’ the regex pattern [^\s]* will match everything until a space character is encountered.
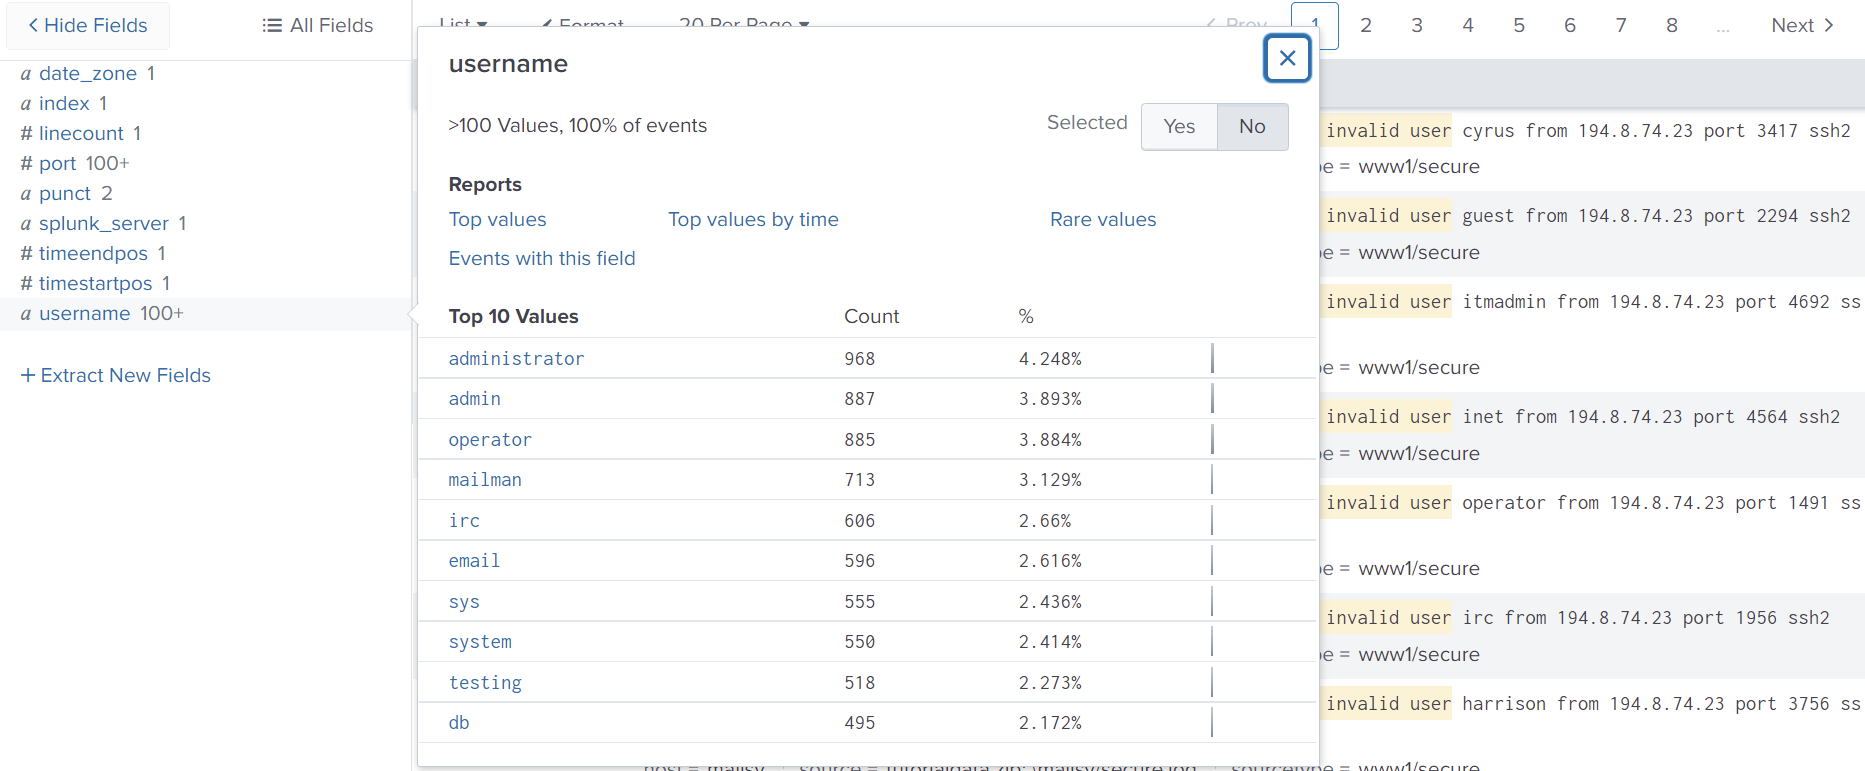
This provides us with the new field username. We can now see that ‘administrator’ had the most failed attempts in logging in. We could also generate basic reports and use this extracted field elsewhere like any other.
Transactions
The transaction command combines multiple events into one based on a specified starting point and an ending point.
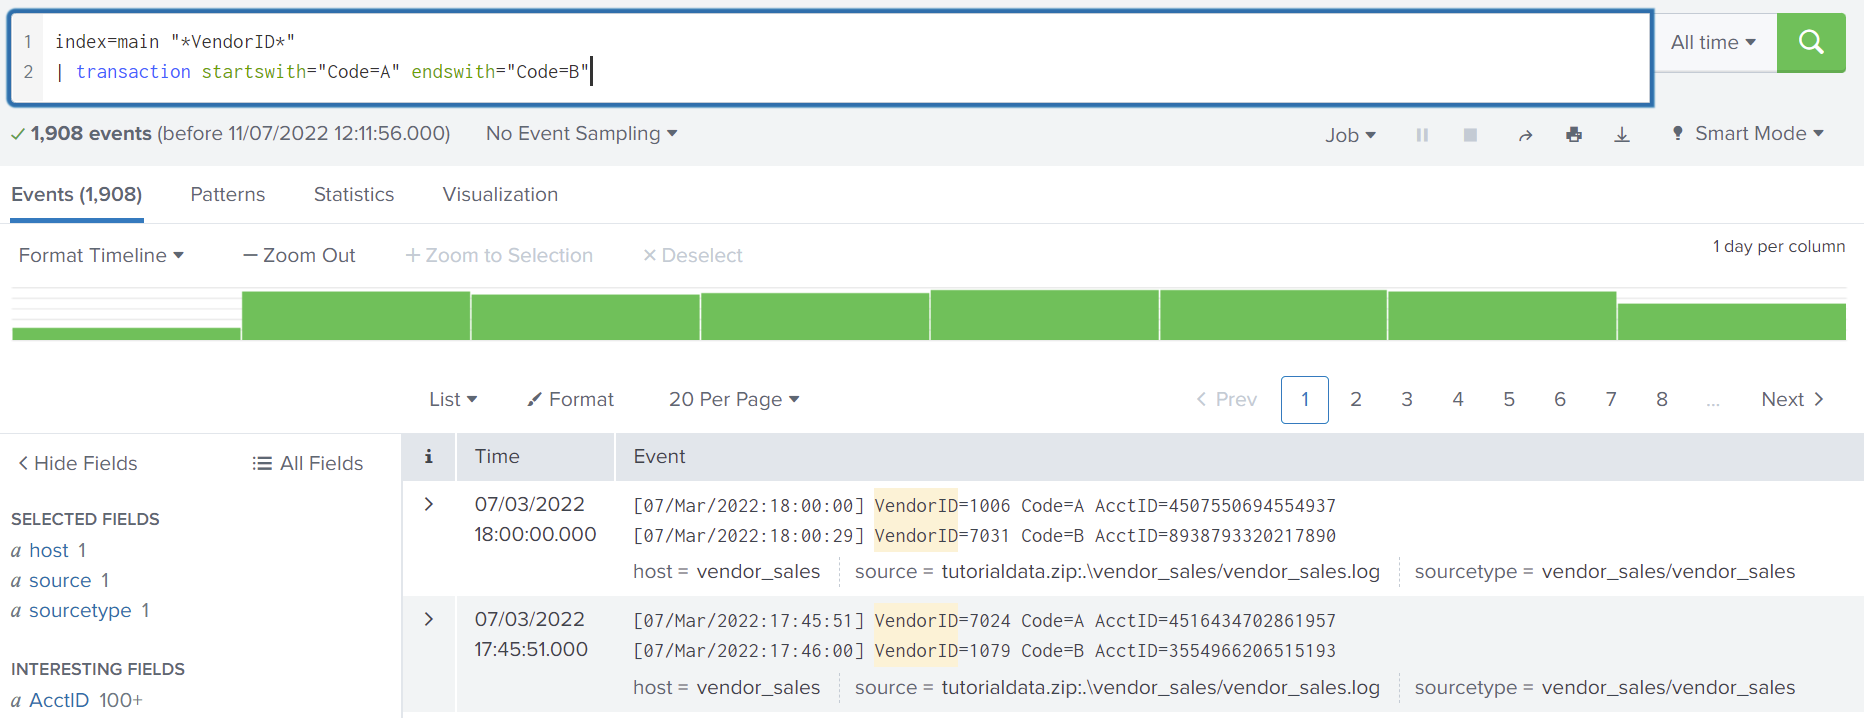
Suppose we have system A and it makes a call to system B. System A logs when it calls B, and system B logs when it receives the request. We can use a transaction to match the two outputs. This could allow us to extract more information, such as the duration between the two events. Having this information could answer questions such as what is an appropriate timeout to set or how many timeouts can we expect.
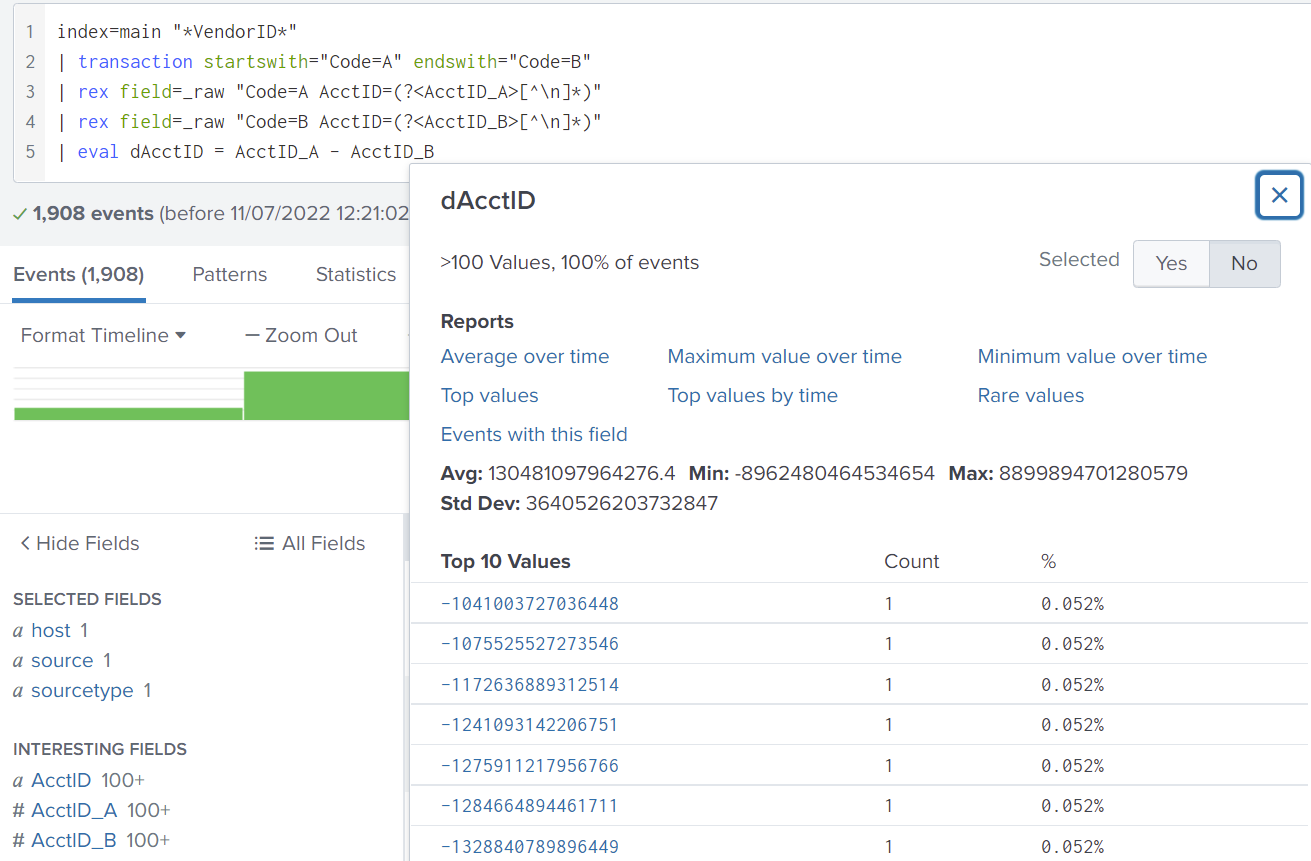
Below is a demonstration built upon the initial transaction. It does not actually provide any more insight to the behaviour of our system. I used a transaction to combine two events, both that have an account id. Since the account id is a numeric field, I could work out the difference between the two values with the eval command. Again, this evaluation is not very useful, but it shows how you could extract fields in a matched pair then use it for evaluations.
Subsearches
Subsearches can be used to retrieve information that is added to the primary search. This is useful for retrieving dynamic data that may be changed each time the search is run. A subsearch can be specified by enclosing a query in square brackets [ ].
Splunk’s search tutorial uses this subsearch example:
sourcetype=access_* status=200 action=purchase
    [search sourcetype=access_* status=200 action=purchase
    | top limit=1 clientip
    | table clientip]
| stats count AS "Total Purchased", distinct_count(productId) AS "Total Products", values(productId) AS "Product IDs" by clientip
| rename clientip AS "VIP Customer"
The subsearch first identifies a ‘VIP customer’ by searching for the top client ip address that made the most purchases. The primary search then uses this customer to count how many purchases they made, how many types of products there were, and which products they bought. Subsearches can also be used in the join command to perform SQL-like joins for correlating data.
That’s a lot on the topic of searching!
Searching is obviously extremely important for a data platform such as Splunk. The SPL is rich in features and can do much more than what I can feasibly cover in this post.
Reports, Alerts, and Dashboards
Splunk can be used for reporting and visualising data. For example, the query:
sourcetype=access_* status=200
| stats count by action
The transforming command ‘stats’ is used to count the number of occurrences for each action. With the search results ordered in a data table, I can then select a chart to visualise this data.
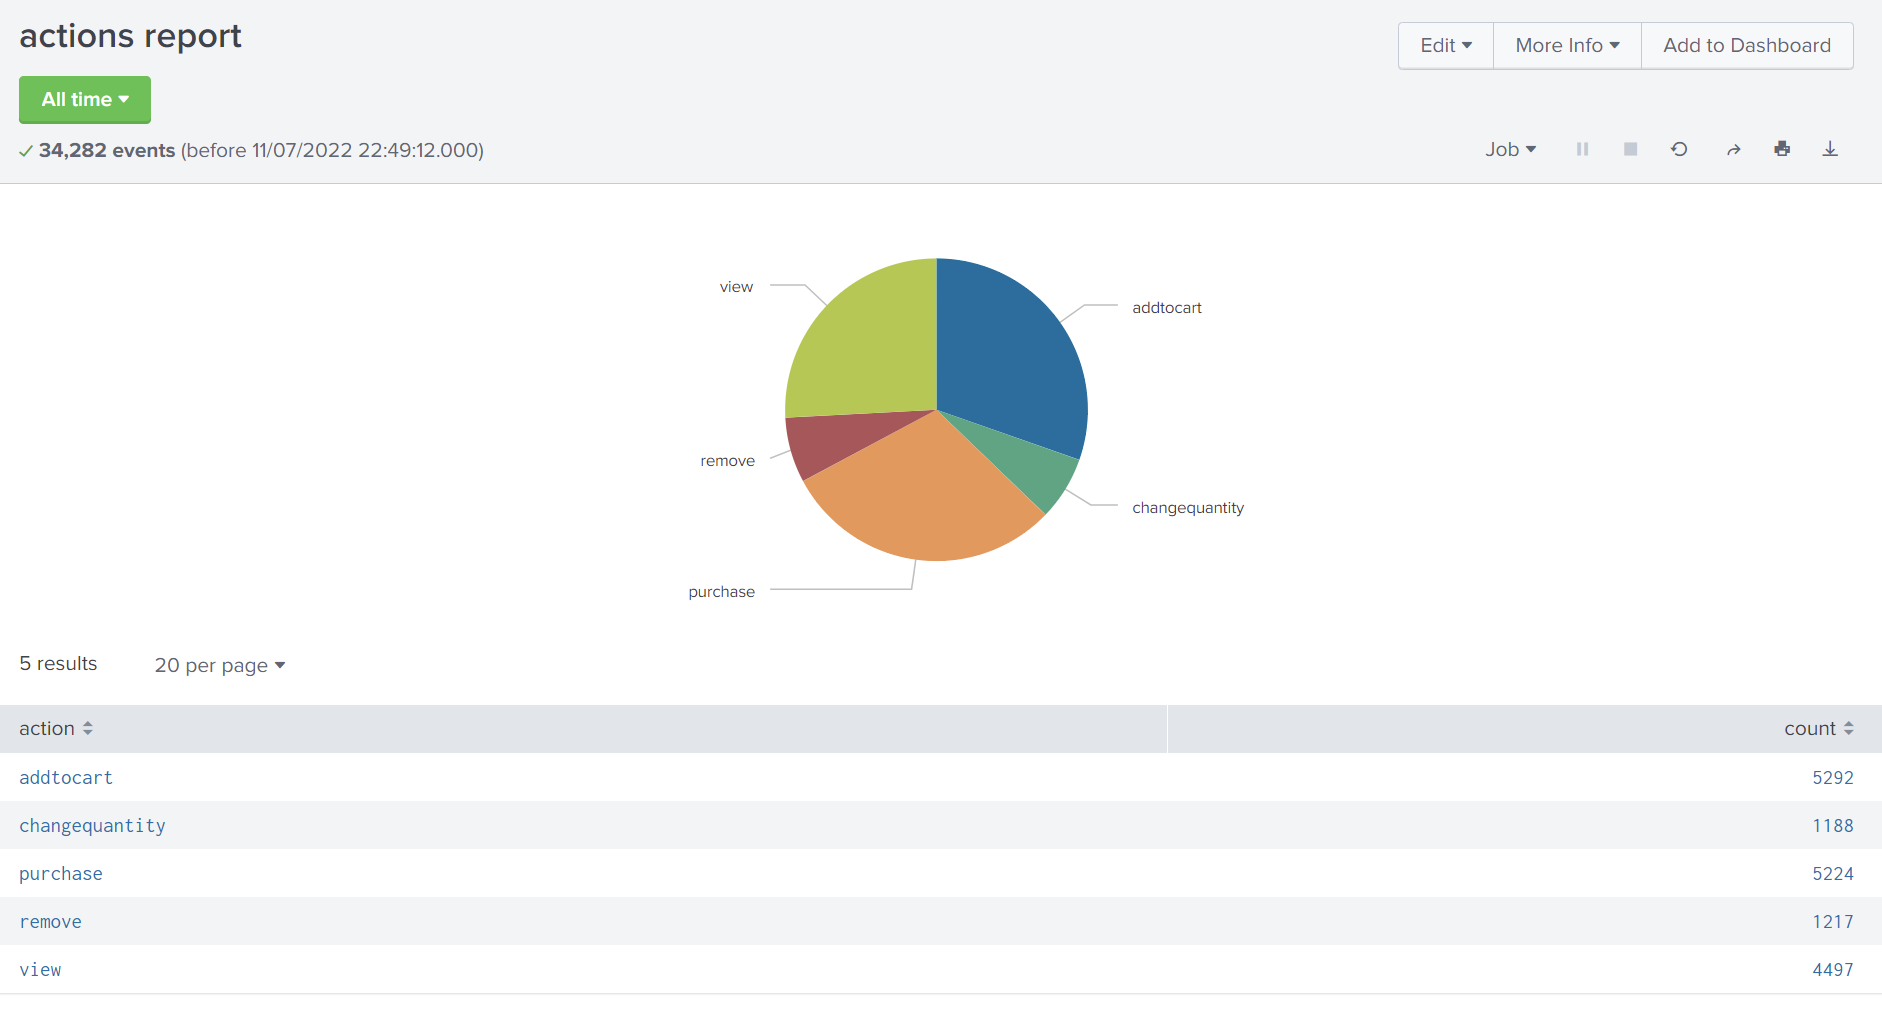
There are many types of charts available: line, bar, scatter, etc. I decided to pick a pie chart and save it as a report. I can open the report to get the latest information even with new events added, and I also have the option to select a new time window to run the query on.
Alerts can also be created on searches. Alerts monitor the search results and will trigger an alert action that can notify stakeholders when a trigger condition is met.
Dashboards can be created to present a collection of reports in panels.
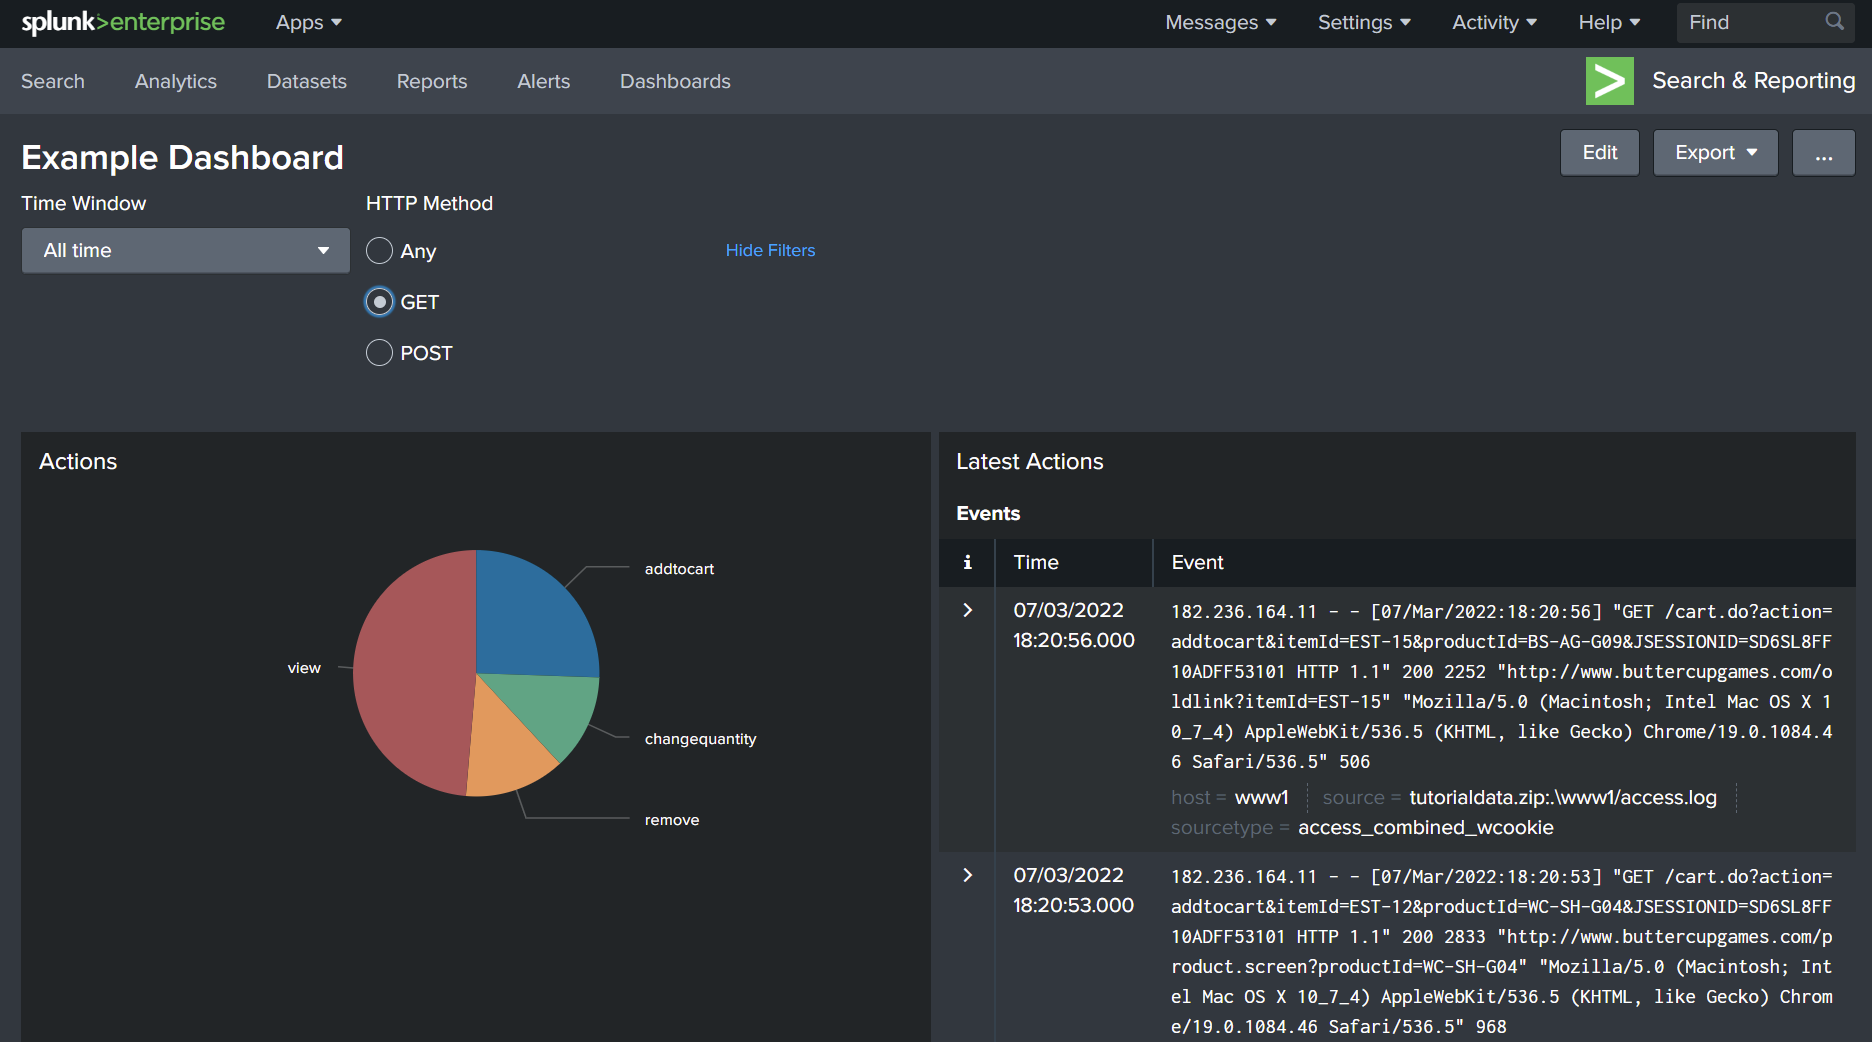
The figure above shows an example dashboard with two panels: an actions pie chart and latest events with actions. The panels both share the dashboard’s time window and I created an input ‘HTTP Method’ to dynamically change the query.
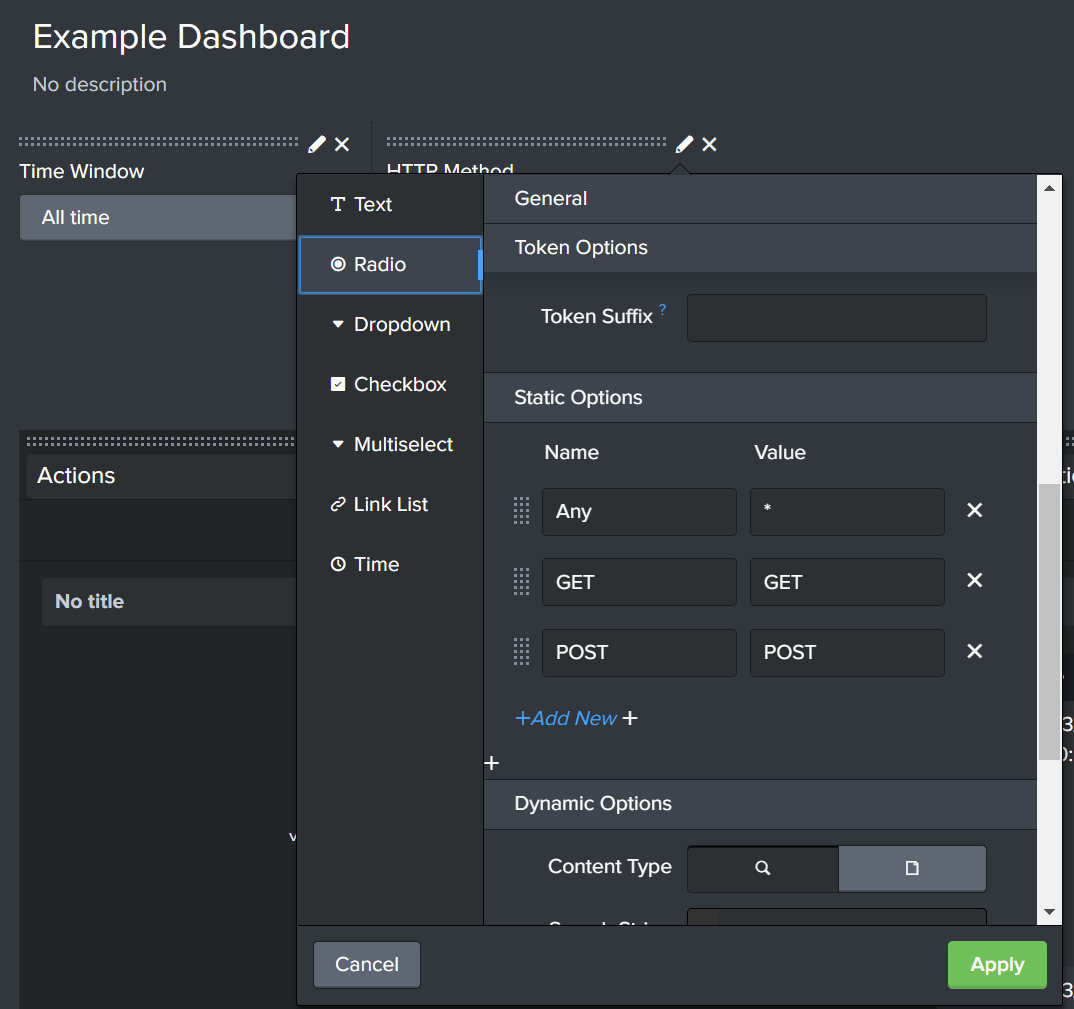
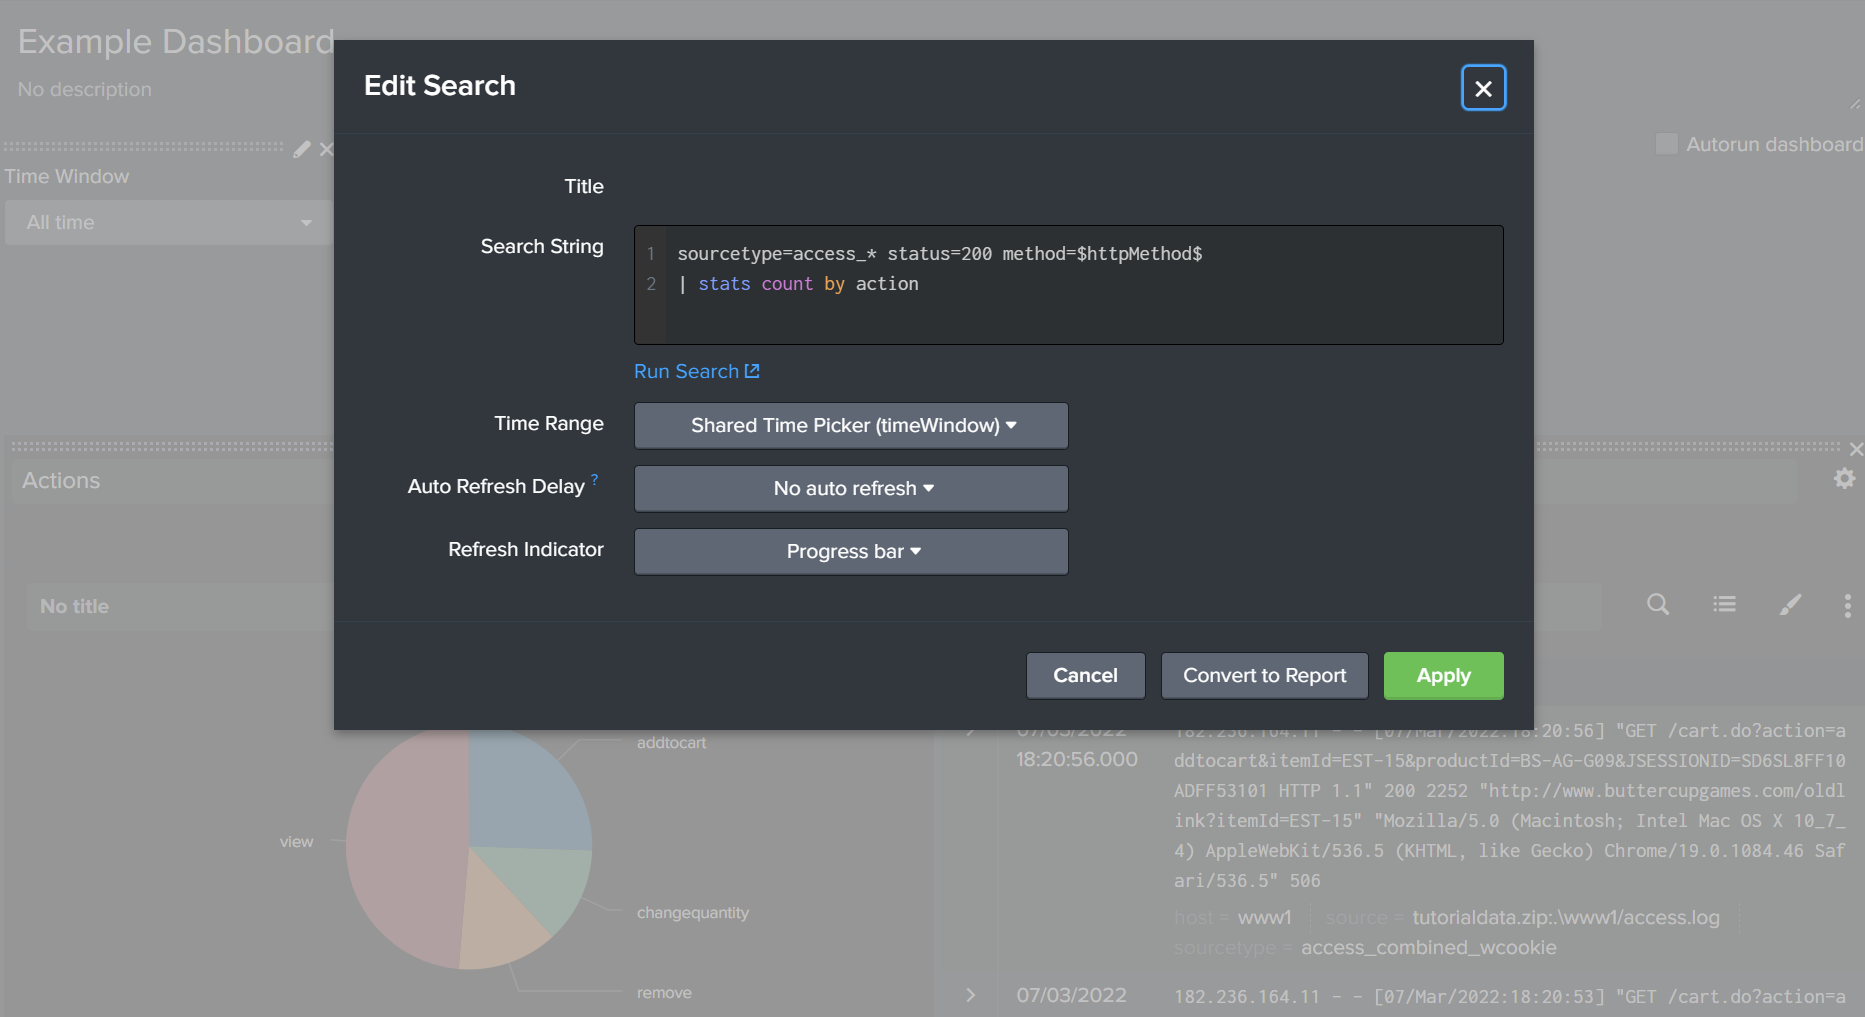
The ‘HTTP Method’ radio input has been given the token name ‘httpMethod’. This token can be referenced in the search query using $httpMethod$.
Dashboards can give live updates on aspects of a system. Some ideas for dashboards could be monitoring user activity, presenting load testing metrics, or observing errors.
You can do much more
My exposure with Splunk has been limited to searching, reporting, and creating dashboards to monitor systems. These default applications are powerful and contain a lot of details when learning about them, but Splunk has many more applications to explore. There are thousands of apps available on SplunkBase that you could install. These apps are split into different categories:
- IT Operations
- Security,Fraud & Compliance
- Business Analytics
- Utilities
- IoT & Industrial Data
- DevOps
Many of these topics are beyond my expertise and the scope of this blog post. However, it is fascinating to know how much Splunk can offer, and how the tool has something for all roles.
Conclusion
A data platform such as Splunk ingests all manner of data about our systems and enables us to interpret this data meaningfully. I have found incredibly valuable use cases such as: coordinating activities with other teams, improving my understanding of complicated systems, and capturing evidence to prove that my implementations meet the acceptance criteria of its requirements. I certainly would like to improve my ability to leverage machine data and would recommend exploring the idea of setting up a data platform if your systems are not currently employing one.