
Introduction
As part of a project onto the carbon footprint of mobile computing (CFoMC), we required a method to be able to record the energy use of certain computational workloads on differing mobile devices, part of that being Android mobile devices. So we needed a method to accurately measure the energy use on a device.
Why measure energy use?
The reason why we wanted to measure the energy use was to compare the energy use of the same code / calculations across different devices. To do this we used some standard off-the-shelf mathematically CPU heavy tests to be able to keep repeatable results.
Methods of measurement
From investigation we determined there was many ways to measure energy use, generally split into three different methodologies.
Hardware Based
Power meters / monitoring hardware can provide energy values based on how much power the phone is drawing when fully charged to perform a particular process. This is the preferred method of several companies that perform energy evaluations of applications, but consumer-grade power monitors also claim to have an accuracy of +-2%.
Model Based
This methodology takes indicative energy usage values for a given component and calculates the power used based on modelled data. For example, “Processor x running at frequency y for z amount of time uses this amount of energy.” These calculations are then repeated for each piece of equipment concerned and totalled up to an estimate. These methods do not typically give accurate numerical values, but are used to work out relative consumption. The Android Studio profiler seems to be based on this method.
Software / API Based
These solutions consist of software that aims to estimate energy consumption based on data from API calls and calculations based on data gathered by the device. Within this category there are solutions which need to be connected to an external device using the ADB (Android Debug Bridge) and others which can run natively on the device.
Crossing the (Android Debug) Bridge
Luckily, the Android OS already quietly tracks some energy usage statistics in the background. This data is typically used by system apps to inform users when apps are disproportionately draining their battery and provide estimates of remaining battery hours depending on their personal usage. By connecting an Android phone to a PC using ADB (Android Debug Bridge) we can request a dump of this raw data, sometimes going back as far as several days. The sample rates vary by device, but can be relied upon to provide current, voltage and timestamp values over a period of time.
Tools like Powdroid have been designed to ‘wrap around’ an Android app session to help capture these ADB values. Powdroid is launched from a python script on the command-line of a PC connected via USB to the Android device. The script then runs the ADB commands for us and processes this data dump into a more digestible csv format. We set out to test the power draw of an off-the-shelf benchmark (PC-Mark) using Powdroid and ADB to evaluate what was possible with this data. This was the methodology:

The results from this were promising, with off-the-shelf benchmark apps consuming much more power than an idle workload. However, after performing this process for a few workload runs, it became clear how error-prone and time consuming it could be to rely on an ADB-based solution if running more than a handful of tests. We wanted to see if it was possible to streamline the process down to just this:

This new workflow would take place entirely on the device, without needing to tether it to a PC aside from a one-time initial app installation. Since modern Android hardware is more than capable of making calculations based on this data at the scale we need, the energy estimation calculations would take place within our app at the end of each run, with the results shown to the user seconds after the workload has finished. The missing piece, then, was getting this battery data into our own app’s memory at a steady sample rate, concurrently alongside our workloads.
Burning the (Android Debug) Bridge
To create a method to gather the battery data without the need for any external connections, we decided to make use of the Battery Manager API. This allows us to query the device itself for battery information, with control over the sample rate and what data we receive.
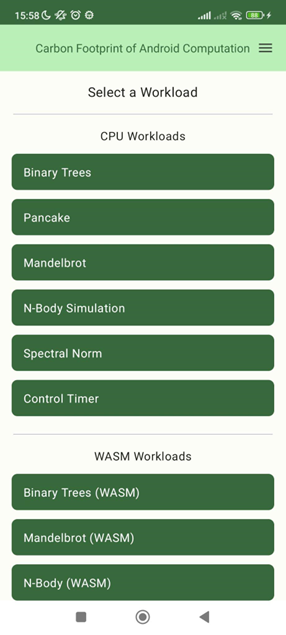
To enable this we created an app using Kotlin which would run the CPU intensive workloads mentioned above.
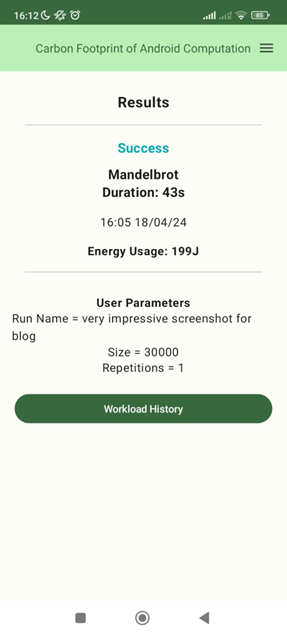
Which can then give a a report at the end of a workload giving a nice accurate figure for the amount of energy used.
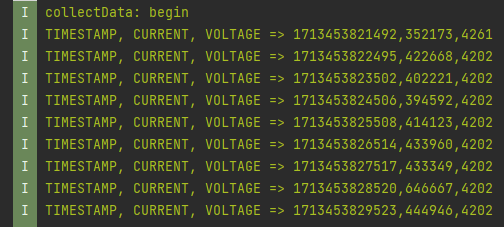
Using the Battery Manager API, we can query the device for its battery status at various point / intervals and collate results over time to be able to calculate the energy usage of a specific workload. The API can gather detailed information on a devices battery status at a point in time, such as the current power left in a devices battery.

Services
Using a service this allows us to run a separate process behind the main process which can monitor the devices battery. We can then create a reusable method to monitor the energy use throughout a process. We can choose the sample rate of how often we record the power levels, then keep it in a list so we can see changes over time of energy use, to be summarised and collated when the process has finished.
Battery Manager API
The battery API can gather a selection of information out from the device, for calculating the energy use from the API we extract the BATTERY_PROPERTY_CURRENT_NOW which is the current current of the battery in Microamps.
currentPower = BatteryManager.getIntProperty(BATTERY_PROPERTY_CURRENT_NOW)
We also need the Voltage of the device in question, because power = voltage * current, this is acquired via the via the context and intents of the application.
	intentFilter: IntentFilter = IntentFilter().apply {addAction(Intent.ACTION_BATTERY_CHANGED)}
	receiver: Intent? = context.registerReceiver(null, intentFilter)

	deviceVoltage = receiver?.getIntExtra(EXTRA_VOLTAGE, Int.MIN_VALUE)
Going from raw sample values to energy consumed
From the collection of data points we collect, we then can use this information to calculate the energy used into Joules. From the list of data we can work out the energy use between two points.
    currentInAmps = recordedCurrent / 1000000.0
    joules = currentInAmps * timeDifference * voltage
For our measurements we took samples every 1 second, so when calculated we had a array of joules used in each second of the process. To get the total amount of energy used we had to sum up all these values to a figure for the entire process.
Pitfalls and limitations
There are a few limitations to measuring the devices power by these methods, most can be negated or controlled by ensuring certain device conditions
- The phone cannot be plugged in / charging
If the device is plugged in the battery manager can give incorrect results as it may be charging the device which can cause a negative power measurement.
- Emulators cannot record power correctly.
When using the app in development using an emulator it cannot record the power correctly as the battery is also an emulation and does not charge/discharge like a proper device.
- Other apps may interfere with results
If there are other apps / system processes running they may impact results. While running tests for the CFoMC project we had a set list of conditions a device must be in for each test.
- We use power to monitor the power
Our data collection service is clearly going to be consuming some power when collecting energy values. This is inevitable using the background service approach, but it should be a consistent, low trickle of energy across all workloads. To mitigate this, we created a ‘control’ workload with a simple timer so we could consider baseline energy usage in our analysis.