One of the key responsibilities of a software architect is communicating architecture effectively. Architecture never exists in a vacuum — it exists to align people, guide decisions, and help teams move toward the same goals. Whether you’re sketching a new system or explaining how existing components fit together, effective communication means helping others understand the structure, purpose, and implications of the architecture.
While it’s possible to describe a system using a wall of text, it’s rarely the best way. Architecture is complex, and most of the time the fastest and clearest way to convey it is visually. Diagrams help people see relationships, boundaries, and flows at a glance.
But before drawing anything, it’s important to pause and ask two fundamental questions:
- What do we want to show?
- How should we show it?
Modelling vs Diagramming
Many of us have been in meetings gathered around a whiteboard, sketching out boxes and arrows to explore ideas. These ad-hoc diagrams are great for rapid ideation — they help teams align quickly — but they are rarely useful outside that moment. As systems grow in complexity, sketches alone aren’t enough. We need a clearer understanding of the underlying structure we are trying to represent.
This brings us to an important distinction: modelling versus diagramming.
- Modelling defines the structure of a system — its actors, components, responsibilities, and relationships. It gives us a consistent source of truth for the architecture, independent of how it is visualised.
- Diagramming presents that model in a particular way — a visual slice tailored to a specific audience or concern.
A diagram is therefore a view onto the model. It highlights certain elements while omitting others, depending on the story we need to tell.
But different people care about different stories. In any organisation, systems may have multiple users, internal and external teams, logical components, and supporting infrastructure. The relationships between these layers quickly become complex.
Trying to show everything in one diagram would be overwhelming. A CTO may care about high-level system interactions, while a security officer needs low-level networking details. Each stakeholder has different concerns — or viewpoints — and no single view can satisfy them all.
This is why we create multiple views, each shaped by a specific viewpoint and tailored to its audience. The model remains the one source of truth; each view shows only the part that matters for a given concern.
As an analogy, think about the architectural plans of a house. A single structural model can be used to produce:
- a floor plan for layout and navigation,
- an electrical plan for wiring,
- a plumbing plan for water and waste.
Each plan is a view of the same underlying structure, created from a different viewpoint. If an architect moves a wall but the electrical and plumbing plans aren’t updated to reflect it, the result would be chaos!
Software architecture works the same way. The model holds the truth about the system; diagrams are purposeful views that help different people understand and make decisions about it.
The Spectrum of Approaches
When deciding how to model and create views, there’s no one-size-fits-all solution. Instead, there’s a spectrum - ranging from highly structured, formal modelling approaches to informal, free-form sketches. Each approach has its place depending on the context, audience, and longevity of the diagram.
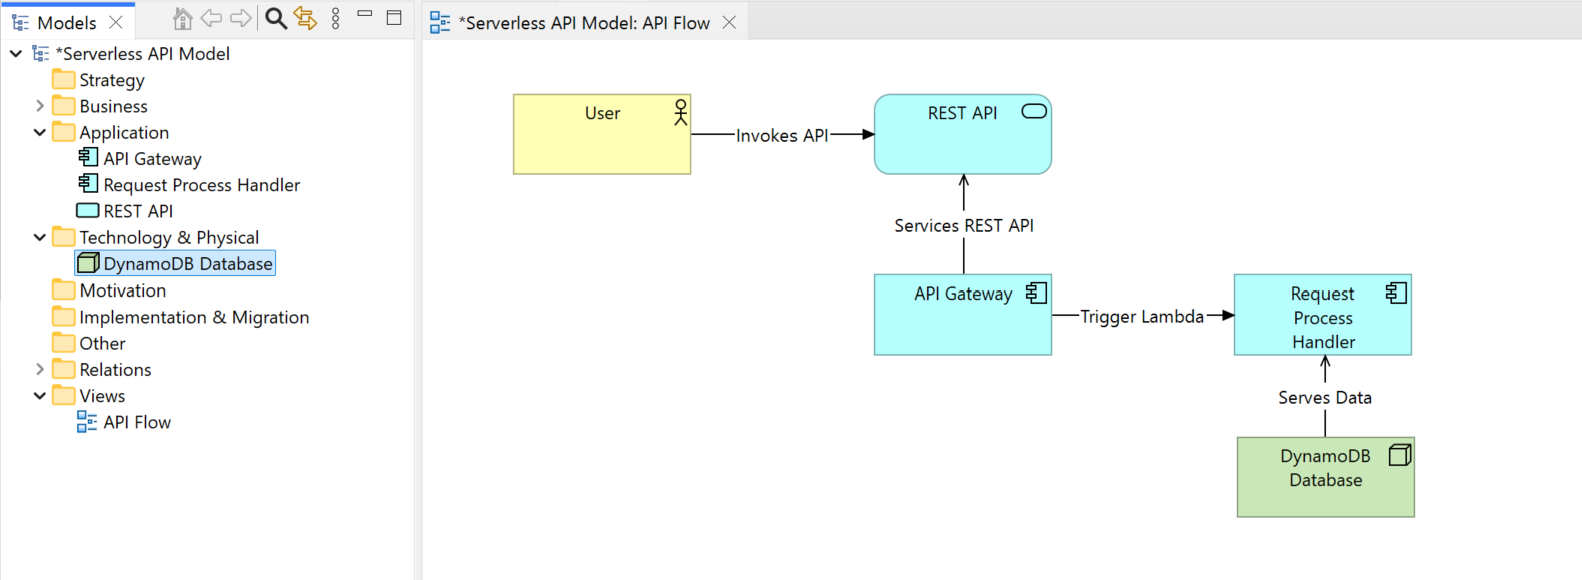
At one end of the spectrum, we have heavyweight and structured approaches such as UML and ArchiMate. These approaches enforce strict semantics and provide a rich modelling language. They are often used in enterprise-scale architecture where consistency, traceability, and alignment with frameworks like TOGAF are required. The trade-off is that they require significant effort to maintain, have steep learning curves, and may not be accessible to non-architects.
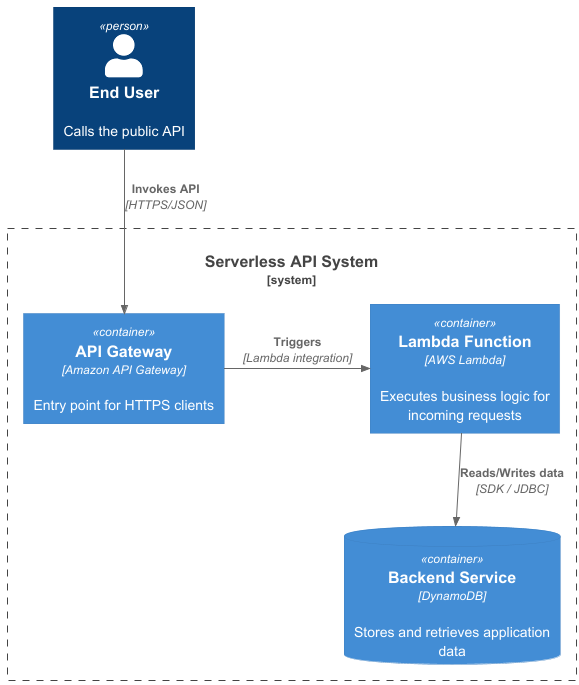
In the middle, we find lightweight but structured approaches such as the C4 Model, which emphasise maintaining a consistent underlying model, but with far less formality. This supports clarity and coherence without the prescriptiveness of a full modelling language, and makes producing and evolving views far more manageable.
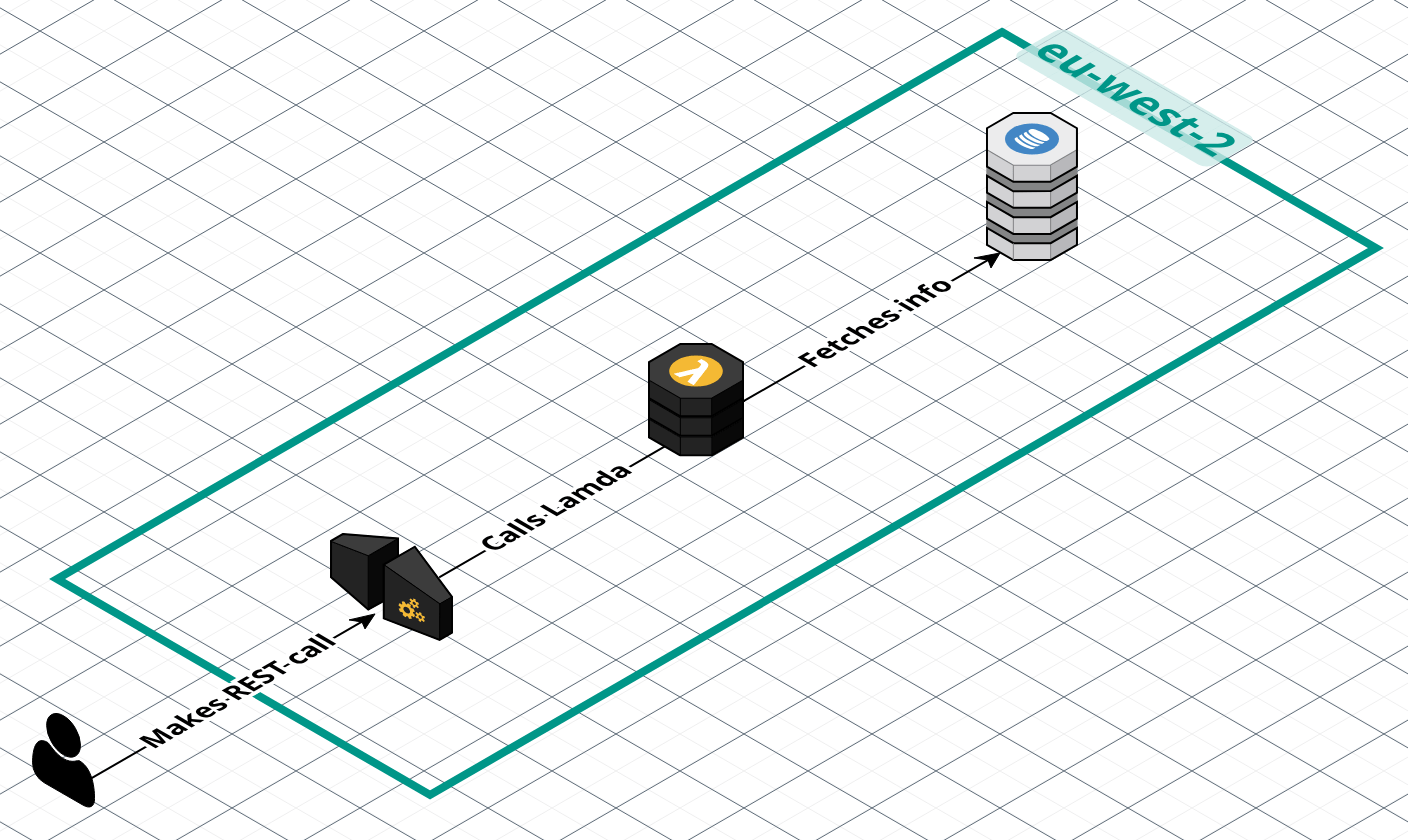
Cloud diagrams that use AWS or Azure icon sets also sit broadly in this category. They offer a standardised visual vocabulary that improves clarity and consistency, but they stop short of providing a true modelling approach.
At the far end of the spectrum, we have lightweight and unstructured approaches - free-form diagrams created on whiteboards, both physical and virtual. These are ideal for exploring or conveying an idea quickly and for collaborative workshops. They are fast, intuitive, and unconstrained, but they lack an underlying model and can quickly become inconsistent as systems evolve.
Choosing the right approach is always a trade-off between consistency, governance, and ease of use. It depends on how long the diagram will live, who will maintain it, and how complex the system is.

Tooling Landscape
Once you’ve decided how structured your approach needs to be, the next step is choosing the right tools. Broadly speaking, diagramming and modelling tools can be grouped under the following categories.
Diagrams as Code
Tools like PlantUML, Mermaid, and Structurizr DSL allow you to define diagrams using text. These are ideal for teams who treat architecture like code — enabling version control, CI/CD integration, and automated documentation.
They work particularly well when architecture needs to evolve alongside code. Diagrams can live in the same repository, be reviewed like any other code change, and even be generated automatically as part of a pipeline. The trade-off is that layout control can be limited, and the output may lack the polish of a hand-crafted diagram.
@startuml
!include https://raw.githubusercontent.com/plantuml-stdlib/C4-PlantUML/master/C4_Container.puml

Person(user, "End User", "Calls the public API")

System_Boundary(sys, "Serverless API System") {
    Container(apiGw, "API Gateway", "Amazon API Gateway", "Entry point for HTTPS clients")
    Container(lambdaFn, "Lambda Function", "AWS Lambda", "Executes business logic for incoming requests")
    ContainerDb(backend, "Backend Service", "DynamoDB", "Stores and retrieves application data")
}

Rel(user, apiGw, "Invokes API", "HTTPS/JSON")
Rel_R(apiGw, lambdaFn, "Triggers", "Lambda integration")
Rel_D(lambdaFn, backend, "Reads/Writes data", "SDK / JDBC")

@enduml

Model-Driven Tools
Enterprise tools such as Archi, Sparx Enterprise Architect, and Visual Paradigm focus on maintaining a central model and generating views from it. This ensures consistency across diagrams and supports traceability — linking requirements to architecture and even to implementation.
These tools are powerful but require discipline and effort to keep up to date. They are best suited for large organisations with formal architecture governance or regulated environments where long-lived models are essential.

Visual Diagramming Tools
Tools like Lucidchart, Miro and draw.io prioritise collaboration and simplicity. They mimic the experience of sketching on a whiteboard but add features like templates, real-time collaboration, and cloud storage.
These tools are great for workshops and stakeholder engagement, but they lack an underlying model. As a result, they can become inconsistent and hard to maintain as systems grow.

Cloud-Specific Tools
Tools like Cloudcraft, Hava, and AWS Workload Discovery integrate with live cloud environments to automatically generate diagrams. These tools reflect the actual state of deployed systems, which is invaluable for audits, onboarding, troubleshooting, and operational visibility. Many can also ingest Infrastructure as Code (e.g., Terraform) to visualise deployments directly from source.
Although automation makes these diagrams quick to produce, it also constrains them. Because they mirror the raw cloud resources exactly as they exist, there is very little scope for layout, grouping, or abstraction. As a result, they are not well suited to future-state design, architectural storytelling, or conveying logical intent rather than physical infrastructure.

What about AI-assisted diagrams?
LLMs introduce a new angle: because diagrams can be defined as code, we can now generate formats such as Mermaid or PlantUML directly from natural-language descriptions. This makes it much faster to produce early drafts and explore different ways of expressing a model.
But this approach has a fundamental limitation: diagrams are spatial and visual, while LLMs predict text. An LLM can create valid syntax, but it cannot reliably judge whether a diagram will be readable, balanced, or visually coherent.
To address this gap, AI features are emerging inside visual diagramming tools themselves — for example Miro, Lucidchart, and dedicated tools like Eraser. These may be able to more intelligently integrate with layout engines and can prompt a user to clarify their intent; producing more coherent visuals while still keeping a human in the loop. AI tools are also being integrated directly into code-bases to generate documentation, including diagrams - such as Google’s CodeWiki or Devin’s DeepWiki.
LLMs also have potential to support the modelling process more directly. By connecting to codebases or live infrastructure, they can answer natural-language questions (“Which services call this API?”), help infer relationships, and assist in keeping architectural models aligned with the real system.
AI-assisted diagramming is most effective as augmentation rather than automation. By combining automated insights with natural-language interaction, these tools have the potential to reduce the effort of creating and maintaining diagrams — while architects still provide the intent, abstraction, and viewpoint needed for effective communication.
Using these approaches effectively
Effective architecture communication is less about the tool and more about the thinking behind it. A clear model provides the structure; viewpoints help us understand what different audiences care about; and diagrams turn those ideas into views that tell the right story at the right level of abstraction.
There is a wide spectrum of approaches available — from formal modelling languages like UML and ArchiMate, to lightweight frameworks such as C4, to completely free-form sketches on a whiteboard. Each has strengths depending on the context, longevity, and the decisions it needs to support.
But it isn’t the tooling that communicates architecture effectively — architects do. What matters most is clarity of intent, and ensuring that whatever we produce, with whichever tool we choose, genuinely reflects that intent.
