
2017 update
A lot has changed in the world of JavaScript and D3 since this post was written. Check out the d3fc project to see what some of the ideas in this post have evolved into!
In this post, we’ll take a look at some of the performance issues you might encounter when making interactive charts using SVG, and how you might go about fixing them. We’ll use the chart component developed in this post to make a basic OHLC stock chart with zooming/panning. While the chart will be implemented using the D3 library, the performance considerations are the same for any interactive chart using SVG. We’re aiming to be able to smoothly pan and zoom an OHLC chart which shows multiple years of OHLC bars.
Zooming and Panning
There are 2 general approaches we can take to get our chart series to zoom (and pan). They are Semantic zooming and Geometric zooming. With Geometric zooming, we’ll apply a single transformation to the element which contains the OHLC bars. Zooming in will (without steps to prevent it) make the OHLC bars thicker. Semantic zooming on the other hand means that we will transform the position of each OHLC bar individually. Zooming in will keep the OHLC bars the same thickness, and the bars will spread out to reflect their recalculated positions.
We’ll use D3’s inbuilt ‘zoom behaviour’ component to set up zooming on our chart. It automatically creates event listeners to handle zooming and panning gestures on a container element. Better still, it works for both mouse and touch events, so in a few lines of code we can take a static chart and make it zoomable on desktop and mobile devices. Here’s the set up:
var zoom = d3.behavior.zoom()
    .x(xScale)
    .on('zoom', zoomed);
Here, we’re passing in the time scale of our chart (xScale) as the scale that the zoom behaviour should operate on. The zoom behaviour will automatically adjust the domain of the scale when zooming. We’ll handle the zooming itself in the zoomed function.
In the earlier OHLC post, we set up a static chart with an OHLC series in a group element which we called the ‘plotArea’. Now we’ll put another element in this group - a rect element with the same width and height as the ‘plotArea’. We’ll call the zoom behaviour on this element.
plotArea.append('rect')
    .attr('class', 'zoom-pane')
    .attr('width', width)
    .attr('height', height)
    .call(zoom);
This will allow us to pan and zoom the chart by using mouse or touch gestures inside the plotArea. First though we need to implement the zoomed listener, which is where we’ll specify how the chart is zoomed.
Semantic Zooming
Implementing semantic zooming with D3 is simple. Since the domain of the time scale is automatically modified by the zoom behaviour, and our series shares this scale, we just have to call the series component on its original selection. This updates the positions of the bars to reflect the new scale domain.
Here, series is an instance of sl.series.ohlc from the earlier post, but it could be any series component e.g. a d3.svg.line. We’ll use the same pattern to update the chart’s axes on zoom.
function zoomed() {
    var g = d3.selectAll('svg').select('g');

    g.select('.x.axis')
        .call(xAxis);

    g.select('.y.axis')
        .call(yAxis);

    g.select('.series')
        .call(series);
}
See here for what we’ve got so far - a basic OHLC chart with semantic zooming. In this example, we are also modifying the y-scale’s domain to extend from the lowest to highest prices for the days included in the time scale’s domain.
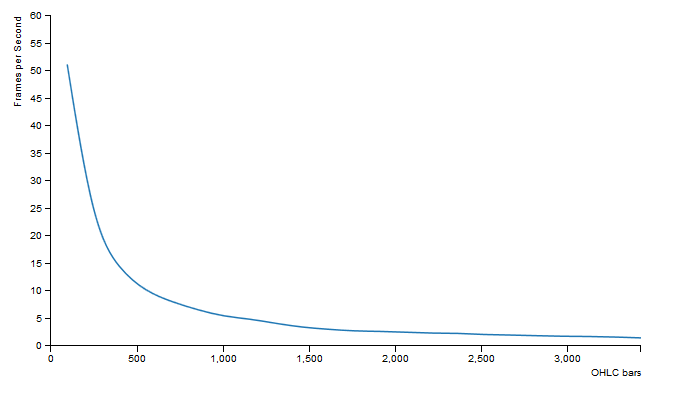
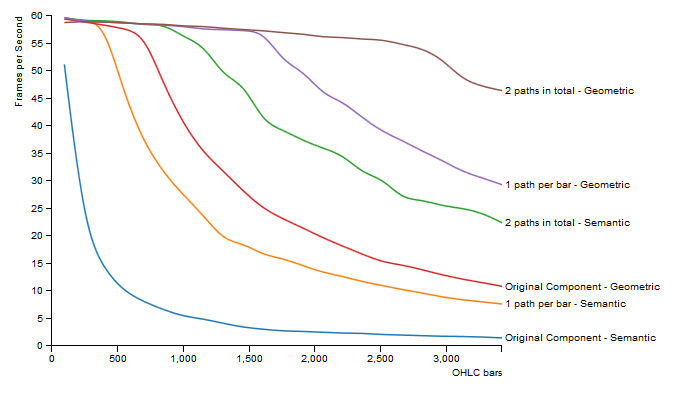
How does this chart perform when panning/zooming as the number of OHLC bars grows? Well, it’s a bit disappointing. The chart below shows the number of frames per second achieved when panning the chart in Google Chrome on a modern desktop computer against the number of OHLC bars on the chart. You can see that the number of frames per second drawn drops off quickly as the number of OHLC bars grows. This is because with SVG and semantic zooming, we have to update the attributes of every DOM node that makes up the OHLC series.
 To speed up the chart zooming, we’ll need to reduce the number of elements we have to update.
SVG Path Language
In our original OHLC component, each bar consists of a group containing 3 lines, and D3’s svg.line component is used to draw the lines. Now that we’d like to reduce the number of elements, we’ll change the way these lines are drawn at (possibly) the expense of less readable code.
Enter the SVG path mini-language! We’ll draw our OHLC bars using SVG path elements. These elements have a ‘d’ attribute that contains a specification of a path composed of moveTo, line, curve, arc, and closePath commands. Imagine the SVG path language as describing the motion of a pen that draws lines or curves on the page, and lifts off the page when given a moveTo command.
For our purposes, we can get by with the M (moveto), V (vertical line), and H (horizontal line) commands. The full path language includes commands to draw Bézier and Elliptical curves. Note that commands can be written lower-case to specify drawing relative to current pen position, or upper-case to draw using absolute coordinates.
1 Path per Bar
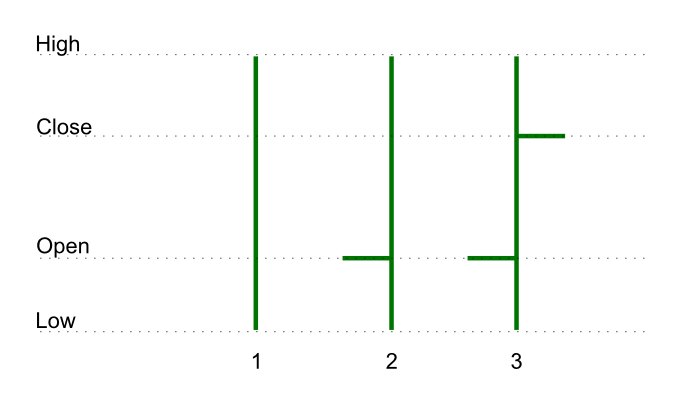
To draw an OHLC bar on paper, we could 1. Move a pen to the low price on a particular day and draw a vertical line to the high price 2. Move to the open price and draw a horizontal line to the left for the open tick 3. Move to the close price and draw a horizontal line to the right for the close tick.
Using this procedure, we can define a function that takes a price object and returns the SVG path language string to draw an OHLC bar for that price object. It looks like this:
var makeBar = function (d) {
    var moveToLow = 'M' + date(d) + ',' + low(d),
        verticalToHigh = 'V' + high(d),
        openTick = 'M' + date(d) + ',' + open(d) + 'h' + -tickWidth,
        closeTick = 'M' + date(d) + ',' + close(d) + 'h' + tickWidth;

    return moveToLow + verticalToHigh + openTick + closeTick;
};
Just like other D3 path generators like d3.svg.line, we’ll make a sl.svg.ohlcBar path generator component which wraps our makeBar function. In this component, we’ll have configurable date, open, high, low and close accessor functions, and a configurable tickWidth. We’ll make an instance of the path generator like this:
var ohlcBar = sl.svg.ohlcBar()
    .open(function (d) {
        return yScale(d.open);
    })
    .high(function (d) {
        return yScale(d.high);
    })
    .low(function (d) {
        return yScale(d.low);
    })
    .close(function (d) {
        return yScale(d.close);
    })
    .date(function (d) {
        return xScale(d.date);
    });
We’ll have to modify the OHLC series component to work with the new path generator. When creating the series, we’ll make our bar elements paths instead of groups, and generate their ‘d’ attribute using the new path generator.
// Inside OHLC series create/update function:
// ...
var bars = series.selectAll('.bar')
.data(data);
bars.enter()
.append('path')
.classed('bar', true);
bars.attr('d', function (d) {
return ohlcBar(d);
});
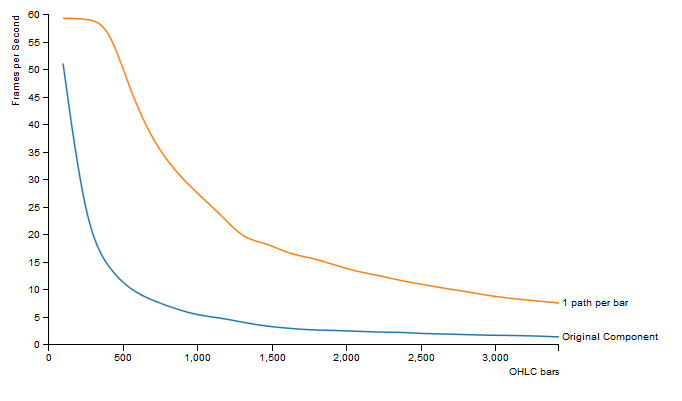
// ...Now that we’re using just 1 element where before we had 4, we get a noticeable speedup.
2 Paths in total
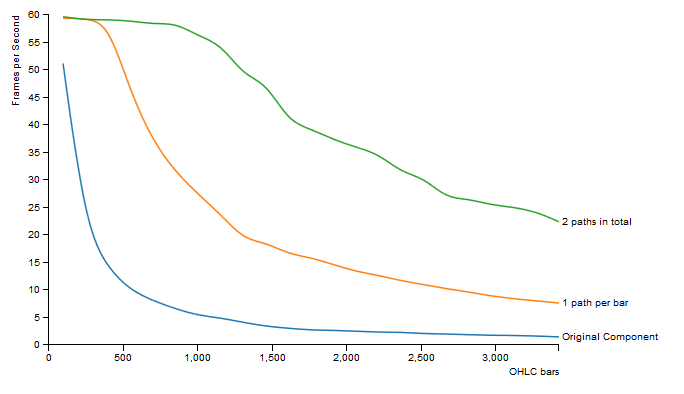
We can take the SVG path optimisation further. Instead of 1 path for every bar, we’ll have 2 paths in total - one for all the ‘up days’ and 1 for all the ‘down days’. To make the ‘d’ attribute for these paths, we’ll call makeBar for each bar as before, but now we’ll concatenate the strings returned.
As expected, we get another speedup.
This has come at a price. Now that we no longer have a DOM element for each OHLC bar, we’ve lost the ability to do interactivity on a per-bar basis. For example, if we wanted to display the OHLC data of a bar on mouse click, now we can’t do that in a simple way. We’d have to look for workarounds like maintaining invisible clickable elements for each bar that update their positions only after zooming has finished, or even manually matching mouse coordinates to bars. If we have to resort to these lower level optimisations for reasonable performance we lose the main benefits of SVG, and it might be worth considering using the <canvas> element instead.
Limited number of OHLC Bars
Another way we could reduce the number of elements to speed up chart zooming is by noticing that we don’t need to draw OHLC bars that are not in the visible plot area. So let’s filter them out when redrawing the OHLC series. To do this, we can filter the data in the zoomed listener to only include bars for days that lie within the bounds of the zoomed time domain. Then we’ll bind this filtered data to the series element before updating the series.
See here for an example.
This is an improvement - if we zoom so that fewer bars are visible, then panning is smoother. Of course the panning performance is not improved when the chart is fully zoomed out, and the effect of changing panning performance at different zoom levels is distracting. We could improve this by drawing bars for each week rather than for each day when the number of days plotted becomes too large.
Geometric Zooming
Now let’s turn to Geometric zooming, where we’ll apply a transformation to the series as a whole. SVG makes this really simple - we just set the ‘transform’ attribute on the group element that contains the OHLC bars.
In our zoomed listener, we can obtain the zoom scale and translation vector of the zoom behaviour from the d3.event object. We can pass these values directly to the transform attribute. Our new zoomed listener looks like this:
function zoomed() {
    var g = d3.selectAll('svg').select('g');

    g.select('.x.axis')
        .call(xAxis);

    g.select('.y.axis')
        .call(yAxis);

    g.select('.series')
        .attr('transform', 'translate(' + d3.event.translate + ')scale(' + d3.event.scale + ',1)');
}
This works as expected, zooming the whole series and making the OHLC bars thicker. This isn’t what we want. For browsers that support it, we can set the OHLC path’s vector-effect property to ‘non-scaling-stroke’. This will cause the stroke-width to not change under the transformation. For browsers that don’t yet support it, we would have to manually adjust the stroke-width of the OHLC paths to counter the transformation.
Compared to semantic zooming, geometric zooming is faster.
Transform for changing Y Scale
One nice feature for zooming stock charts is an automatically updating y-scale. Zooming and panning should change the y-scale domain to extend from the lowest to highest prices for the days included in the time-scale domain. This was easy with semantic zoom - the series updates to reflect the new scale domains automatically. With geometric zoom, we will have to think a bit more!
We want a transformation in y of the series group element to reflect the changing y-scale (the transformation in x is given to us by the zoom behaviour). We can visualise the zooming process as drawing a box on our plotted series and replacing the visible plot area with the contents of the box. The transformation we want does that replacement.
We’ll get this transformation with scale s and translate t by comparing the y-scale domain of this window to the y-scale domain of the original plotted series. The transformation’s scale is the ratio of the lengths of extents of the domains: s = y0/y1.
![]()
SVG transformations are relative to the origin (top left corner) of an element. This means that we’ll need a translate transformation ‘t’ if the upper end of the y-scale domain has changed. t is the the number of pixels we would have to translate the series without any scaling, multiplied by the transformation’s scale: t = -t' * s.
Applying this transformation in our zoom listener looks like this:
g.select('.series')
    .attr('transform',
        'translate(' + d3.event.translate[0] + ',' + t + ') ' +
        'scale(' + d3.event.scale + ',' + s + ')');
Here’s an example of a chart that uses geometric zooming with this transformation.
Having to work out this transformation is a disadvantage of geometric zoom over semantic zoom. Here it was possible to find a suitable transformation, but in other cases (e.g. log scales) it won’t be possible.
Hardware Acceleration
Using the ‘transform’ attribute on an SVG element to zoom and pan has the same performance profile in Google Chrome whether or not we have hardware acceleration enabled. We can get hardware accelerated (bitmap based) panning and zooming by transforming HTML elements with CSS3 instead of transforming SVG elements. To do this we’ll need to separate the series SVG group from the chart, and contain it in a div. We’ll zoom and pan this div element by styling it with the appropriate CSS3 transform (with translate3d or scale3d to trigger hardware acceleration).
While this is very fast on most devices, there are some issues. Now when we zoom, we can’t control the thickness of the bars, and no new OHLC bars appear from either side when panning. This is because the series SVG is converted to a bitmap before zooming. We can improve matters by redrawing the series after zooming has finished (in a zoomend listener), but the overall effect is not as good as transforming the SVG itself.
See here for an example of using this approach (Chrome and Firefox only).
Conclusion
We’ve looked at some of the performance issues of SVG charts, and how we might solve them. What’s clear is that no approach is an obvious winner for optimal SVG chart performance. For our OHLC chart with a linear y-scale on desktop Chrome, a good approach is using 1 path per bar with geometric zooming. For other chart types on different devices using different browsers, it might make sense to use semantic zooming, hardware accelerated CSS3 transforms, filtered data or a combination of these approaches.