Fiddler is a great tool for debugging web requests. I use it often when web testing to observe when data is transmitted/requested and to see what’s being communicated, making it possible to build a picture of the communication between the client and backend services. However, sometimes just observing isn’t enough and you need to dig down into the data being used. Times like this may arise when you need to test logic on the client side that is highly dependent on data received from the backend. Often testing logic like this can be a slow process of manually changing data somewhere on the backend to then trigger different scenarios on the front end. However, if this data is retrieved from a specific endpoint then you’re in a good place to start using Fiddler to intercept those API calls and return the data you need.
Setting up Fiddler
Install Fiddler and have a look around. If you’re following along with the blog post, or the host you’re looking to test against uses HTTPS, then you’ll need to allow Fiddler to decrypt the HTTPS traffic running through the proxy. This can be done by clicking on Tools -> Telerik Fiddler Options -> HTTPS tab and checking the “Decrypt HTTPS traffic” box. I also set the dropdown to “…from browsers only”.
Fiddler decrypts the traffic by acting as a man-in-the-middle. It provides a certificate and uses this to pretend to be the web server to the browser, and the browser to the web server. As such, you will have to set your browser to trust the certificate when you get a warning, or manually add the certificate to the browser’s list of trusted. You can export the certificate from Fiddler by going back to the previous HTTPS tab and clicking Actions -> Export Root Certificate to desktop. You can then import this to your browser list of trusted certificates. Once this is done, you’ll be able to see all traffic that runs through the proxy appearing in the session window.
By default, Fiddler will route and list all HTTP requests in the session window so it’s recommended that you close all unnecessary applications. You can tell Fiddler to decrypt traffic from only certain hosts in the “Skip/Perform for the following hosts” field of the HTTPS menu used above. You can also filter out hosts shown in the sessions list by using the “Filters” tab, selecting “show only the following Hosts”, and then entering the host for the requests you want to display.
Using Fiddler
For the purposes of this short post I’ll be using Postman to fire off API requests to a backend service in the same way a web app would request the data we wish to manipulate. I’ll be using the Spotify API to act as our “backend service”, pointing requests to the ‘track’ end point:
https://api.spotify.com/v1/tracks/{id}
With Fiddler up and running and setting 1xKHE01UMBq2j6FurzGoIB as the track ID, I can use Postman to fire off a GET request to https://api.spotify.com/v1/tracks/1xKHE01UMBq2j6FurzGoIB
and look for the result in Fiddler, it should look something like this(click to enlarge):
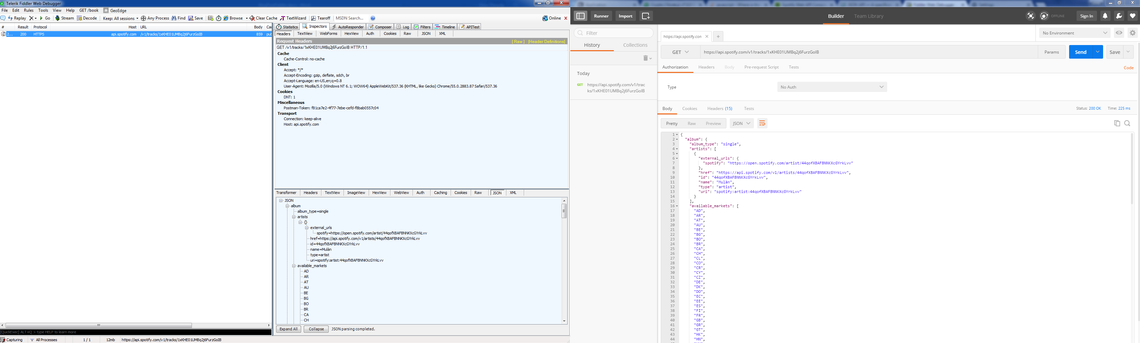
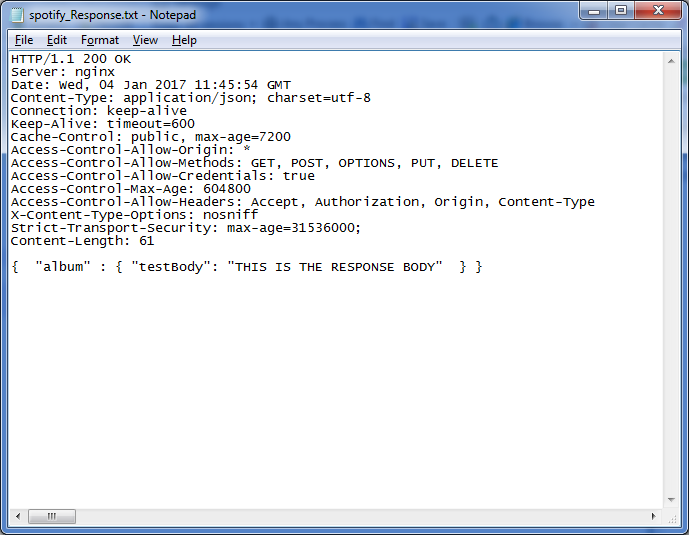
Clicking on the session row will allow you to inspect the request and response data. Clicking on JSON in the bottom right window will show you the JSON body that the API responded with (You may need to click “Response body is encoded. Click to Decode”), this will be the data that is manipulated in the mocked response. The first thing we need to do to manipulate this is get a local copy of it, you can do so by right clicking the session row and then Save -> Response -> Entire Response and saving this as a text file. You can open the file as is, or change the extension to .json and open it in a code editor. You can edit the body data in any way you wish as long as the headers remain the same and the Content-Length header matches the character count of the body once you’ve finished.
With the response body edited to return the data you wish (and the extension returned to .txt if you changed it), we can now set up AutoResponder to use this file as a response. In Fiddler, click on the “AutoResponder” tab and either click on the session row created by the postman request above and then “Add Rule”, or drag and drop the session row into the rule window. This will add a rule to match that URL, with each rule having its own request and response options. By using the rule editor, you can choose the criteria by which it matches requests - this could be regex matching partial URLs, certain headers, or HTTP methods. By default the rule will match the exact URL, which will work for the moment as we only want a response for this particular URL and track ID.
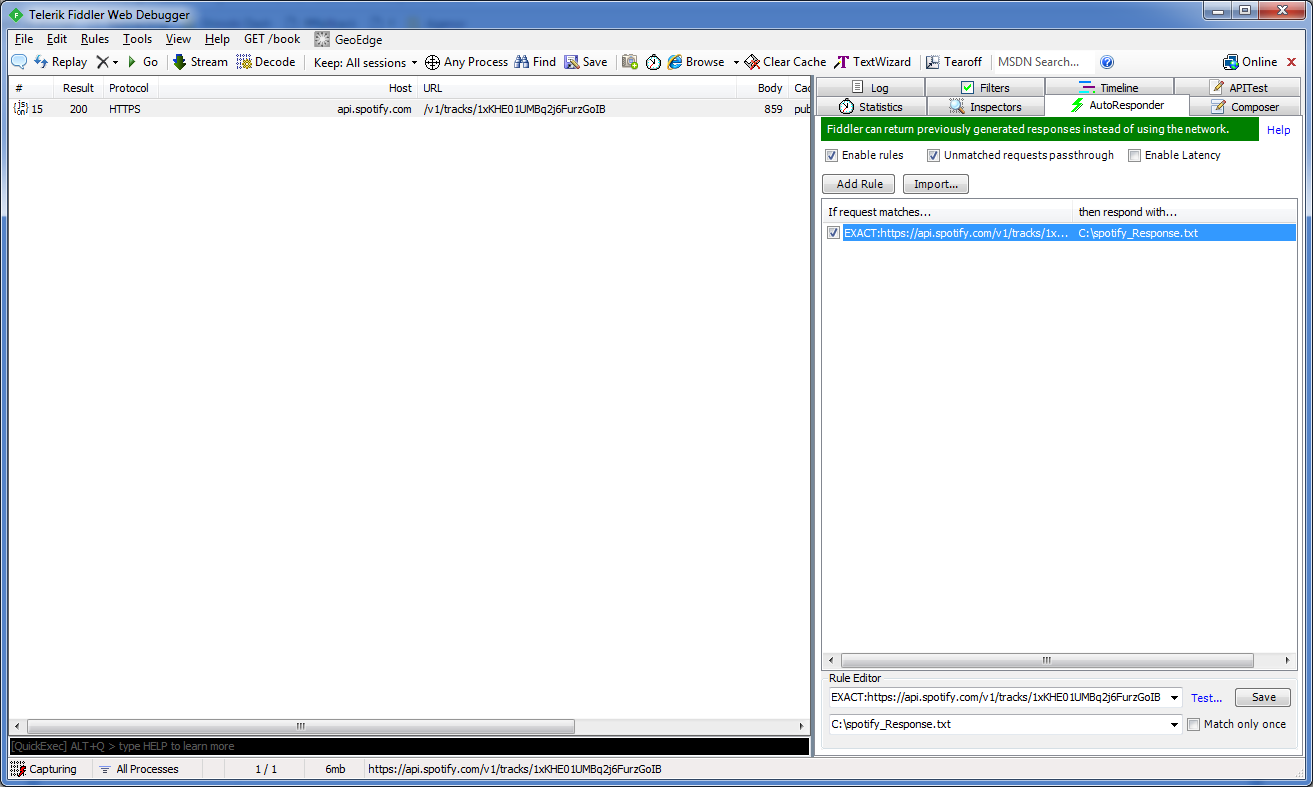
The response is set by using the second dropdown in the rule editor. There are multiple defaults such as 200 OK, 401 Unauthorized, or 404 Not Found, which are handy for testing your site against missing data or other responses. For now, we want to respond with the text file we edited earlier, so need to pick “Find a File” and choose the one we edited. Click Save and then “Enable Rules”.
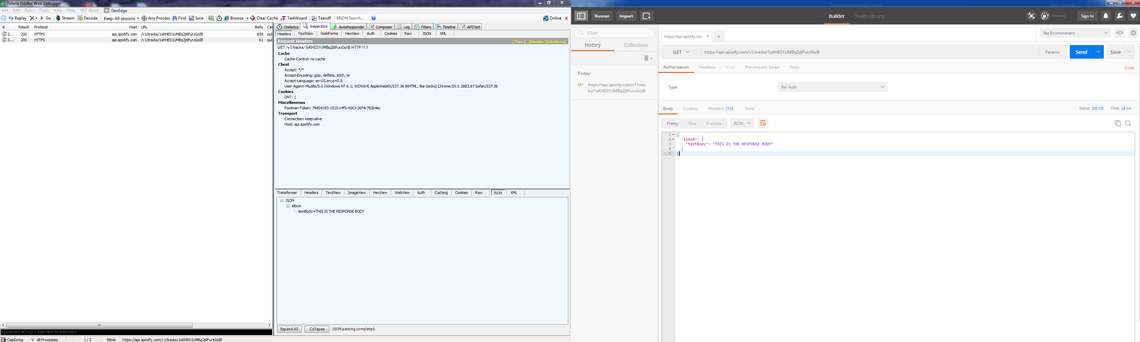
Send the Postman request once again and observe the response body. It should match the body of the file we edited.
Summary
And that’s it. It’s a fairly simple technique but provides some very powerful testing options and hopefully this can now be applied across the sites that you need to test. The API call and response from the web app will appear in fiddler just like the Spotify request from Postman did. Overall, Fiddler is a great tool for throwing light on the less observable end of web app testing, and has become an essential tool in my web testing kit.