
During the past few months, I’ve been working on a collaborative open-source project with JP Morgan called Perspective. Recently, we implemented a D3/d3fc heatmap chart and it was necessary to develop a new legend to represent the data. As a heatmap represents data using a continuous colour scale it, was no longer appropriate to use a discrete legend. The approach we decided on was to use d3fc to create a plot that would represent the same colour range used in the chart. D3 and d3fc are powerful open-source tools for creating charts in JavaScript. D3 is a great library for producing data visualisations in the browser, with d3fc providing a collection of components for common use cases.

Drawing the legend bar
I decided to start developing the legend by creating a bar to represent the colour range without any annotations. In our case, when this legend is drawn we have access to a D3 sequential scale (used when drawing the chart) which provides us with the domain of our data and maps data to colours. This is all we need to begin drawing the legend.
We can start by setting up the D3 scales we need to draw the legend. We’ll be using a band scale for the x-axis, as we want a single bar, and a linear scale for the y-axis, representing a linear colour scale. We can then use the seriesSvgBar and autoBandwidth components from d3fc to draw the bar. This element is drawn as a bar series with each bar being one pixel high, filling the entire plot area. The colour of each line is determined using the provided D3 scale and applied using the d3fc decorate function. To ensure the lines are all the right height and don’t overlap, the previous value in the dataset will be used as the base value.
    // Band scale for x-axis
    const xScale = d3
      .scaleBand()
      .domain([0, 1])
      .range([0, width]);

    // Linear scale for y-axis
    const yScale = d3
      .scaleLinear()
      .domain(domain)
      .range([height, 0]);
The coloured bar is now ready to be drawn by D3. To do this we need to append an SVG, create a g element inside it and get D3 to draw the bar.
    // An array interpolated over our domain where height is the height of the bar
    const expandedDomain = d3.range(min, max, (max - min) / height);

    // Defining the legend bar
    const svgBar = fc
      .autoBandwidth(fc.seriesSvgBar())
      .xScale(xScale)
      .yScale(yScale)
      .crossValue(0)
      .baseValue((_, i) => (i > 0 ? expandedDomain[i - 1] : 0))
      .mainValue(d => d)
      .decorate(selection => {
        selection.selectAll("path").style("fill", d => colourScale(d));
      });

    // Drawing the legend bar
    const legendSvg = container.append("svg");
    const legendBar = legendSvg
      .append("g")
      .datum(expandedDomain)
      .call(svgBar);

Drawing the label
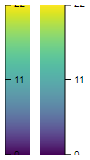
As it is, the legend might look nice, but it’s not very useful! We need to add a label that tells us the range that these colours represent. I decided that the nicest way to do this was to label the extents and middle value of the domain. I also decided that the most simple way to approach this was to draw the axis separately and translate it to the right position.
We can use the d3fc-axis component with axisRight from d3fc to draw our label. We can then provide the same y scale as we used when drawing the bar and tell it to show whatever tick values we like. The next thing to do with this label is to translate it so that it appears on the right-hand side of the bar. We’ll create a new g element to draw the label and translate it to the right by the width of the bar.
    // Defining our label
    const axisLabel = fc
      .axisRight(yScale)
      .tickValues([...domain, (domain[1] + domain[0]) / 2]);

    // Drawing and translating the label
    const barWidth = Math.abs(legendBar.node().getBoundingClientRect().x);
    legendSvg.append("g")
      .attr("transform", `translate(${barWidth})`)
      .datum(expandedDomain)
      .call(axisLabel);
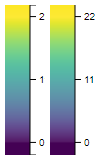
Making it look pretty
There were a few changes I made to the legend to improve usability and provide more consistent styling with the rest of the project. The first was to apply a little padding to the data range of the legend. This means extent labels have a little extra space at the top and bottom of the legend (and also prevents them from being clipped). To make this work for different domain sizes, we can use a percentage padding with extentLinear. This gives us what we want, however, we still have ticks at the very top and bottom of the legend, which now lie outside our domain. This is easily fixed using tickSizeOuter(0) on our axisRight label to hide the ticks at the extents.
    // Padding the domain by 10%
    const paddedDomain = fc.extentLinear()
      .pad([0.1, 0.1])
      .padUnit("percent")(domain);
    const [min, max] = paddedDomain;
    const expandedDomain = d3.range(min, max, (max - min) / height);

    // Removing the outer ticks
    const axisLabel = fc
      .axisRight(yScale)
      .tickValues([...domain, (domain[1] + domain[0]) / 2])
      .tickSizeOuter(0);
There is one other minor styling change that I wanted to make to finish off this legend. I want to see the ticks on the legend but not the vertical line that runs up the side of our bar. We can hide this by selecting the .domain class in the label and setting visibility to hidden.
    // Hiding the vertical line
    legendSvg.append("g")
      .attr("transform", `translate(${barWidth})`)
      .datum(expandedDomain)
      .call(axisLabel)
      .select(".domain")
      .attr("visibility", "hidden");
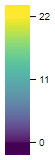
Conclusion
This approach makes good use of d3fc to reduce the amount of D3 code we need to write. This is just one way to draw this type of legend and is the approach that we decided on for our project. I’m sure there are other ways to achieve the similar results. You can look at my block to see a working example of this legend.

