How to Connect Power BI with Azure DevOps and JIRA
It is vital for the development team, Product Owner and business stakeholders to be able to deeply understand the status and situation of product development including forecasting the nearer future. The tool used for that traditionally is tracking progress against a plan often based on estimated effort. Using our team’s expertise seems to make sense - no one else understands the product development as well as they do. However, good estimates need rather deep understanding - which takes a considerable amount of time. When we try to forecast using a planning horizon that is further away this effort becomes costly - especially when considering the amount of change to the scope we regularly see in product development on longer horizons.
In an agile environment, we are using mechanisms for regular inspection like the daily standup or sprint review in Scrum that provide invaluable insight on short time horizons, usually for the current iteration and in some cases for the next, too. We cannot replace this insight gained from the place where the work happens. We can, however, look into all the data we gather along the way and use it to add to our understanding. Some data is already used routinely, e.g. for sprint burndown and velocity charts that provide insight to the team itself. Other tools, e.g. Cycle Time scatter plots and cumulative flow diagrams are less well known and not so well supported by typical issue tracking systems. Even when systems like Jira or Azure DevOps do provide some, it is worthwhile to check their implementation by comparing these artefacts with one you have built yourself. You also have much more flexibility in the fine-tuning of those custom made charts.
We could use Excel for building those charts and for the sake of checking their implementation it would probably be fine to do so. However, when looking into publishing these visuals for a larger audience we don’t want the typical level of manual interaction for data refresh and maintenance. An alternative approach is to use a business intelligence tool like Power BI that provides a robust way of working with the data using transformations that create easily refreshable, shareable and maintainable visuals.
For these reasons - and out of sheer curiosity - I have had a look into creating some of those visuals in Power BI, taking data from both Azure DevOps and Jira. Understanding how to get data out of Jira and Azure DevOps has been an exciting journey, hunting for tutorials, how-tos and examples. Some things have been very easy and straight forward others were surprisingly difficult. This post gives step-by-step instructions for those wanting to try the same - a tutorial that I was missing.
Azure DevOps supports queries using OData which makes connecting Power BI to Azure DevOps straightforward and quick. For Jira there is the option to use a 3rd party tool, e.g. from CData or AIO, or we can use Jira’s REST API. My main example will be the Cycle Time scatter plot which is less widely used and not natively supported by Jira or Azure DevOps (there is probably some third party tool in the marketplace though).
Connecting Power BI with Azure DevOps
The main reasons that make the connection between Power BI and Azure DevOps simple is that we can use OData directly with Azure DevOps, are able to build OData queries within Power BI without a need to write them manually and for the example case of Cycle Time scatter plots the data model has Cycle Time already included without the need of many transformations. Authentication can be done using Azure Active Directory (Azure AD) and Personal Access Tokens (PAT). In my example, I am using the latter which makes it more comparable to the Jira example that uses the same mechanism.
Creating a Personal Access Token
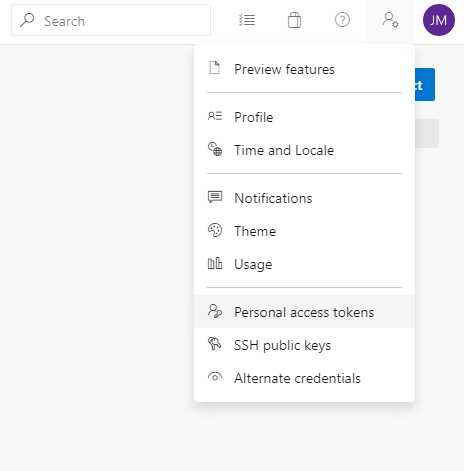
First, we need to create a PAT within Azure DevOps which can be done for each user. On the top right is the profile menu with the Personal access tokens option.
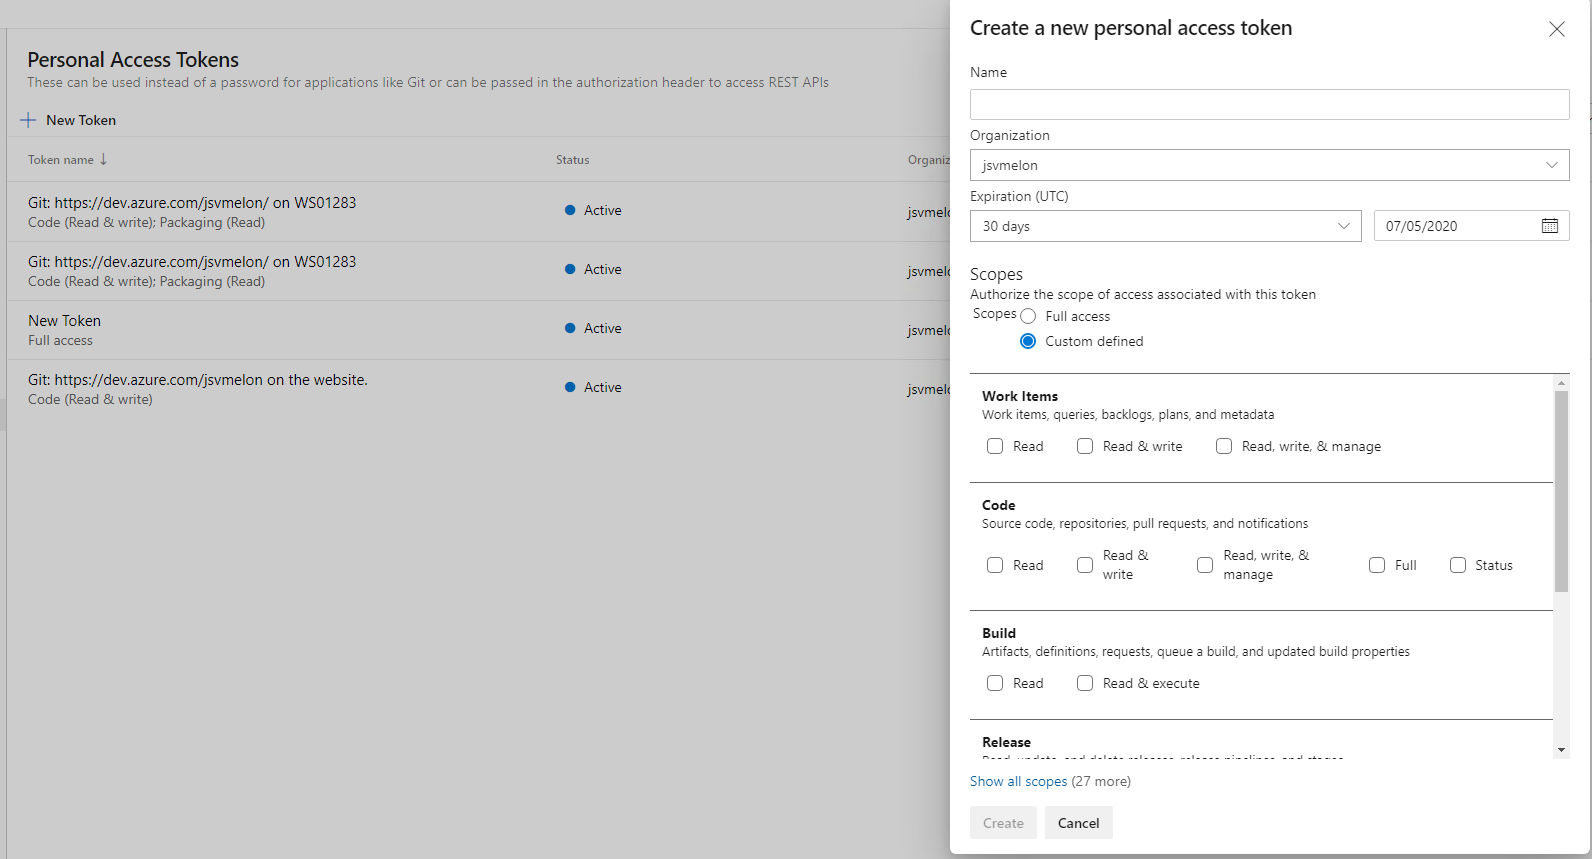
On the following page is the option to create a token and configure the access level settings for that token.
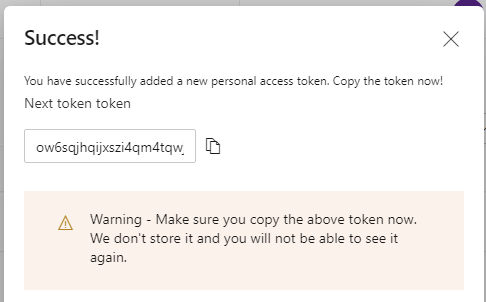
Make sure you copy the token - it is not stored anywhere in Azure DevOps and cannot be retrieved.
Connect using the PAT
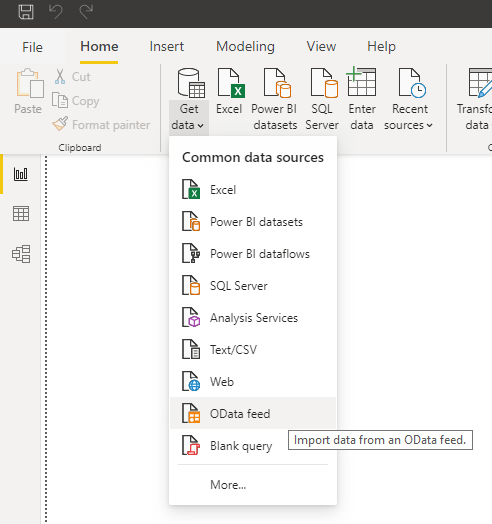
Now that we have the token we make the connection from Power BI using an OData feed from the Get data menu.
When Power BI asks us for a URL to the OData feed we can either use a URL including an OData query or we can use just the base URL as in the screenshot below. This includes the organisation name (jsvmelon) and the project name (Sourdough%20Bread%20Co) and finishes on _odata.
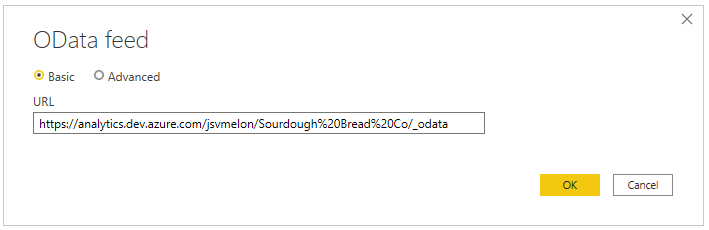
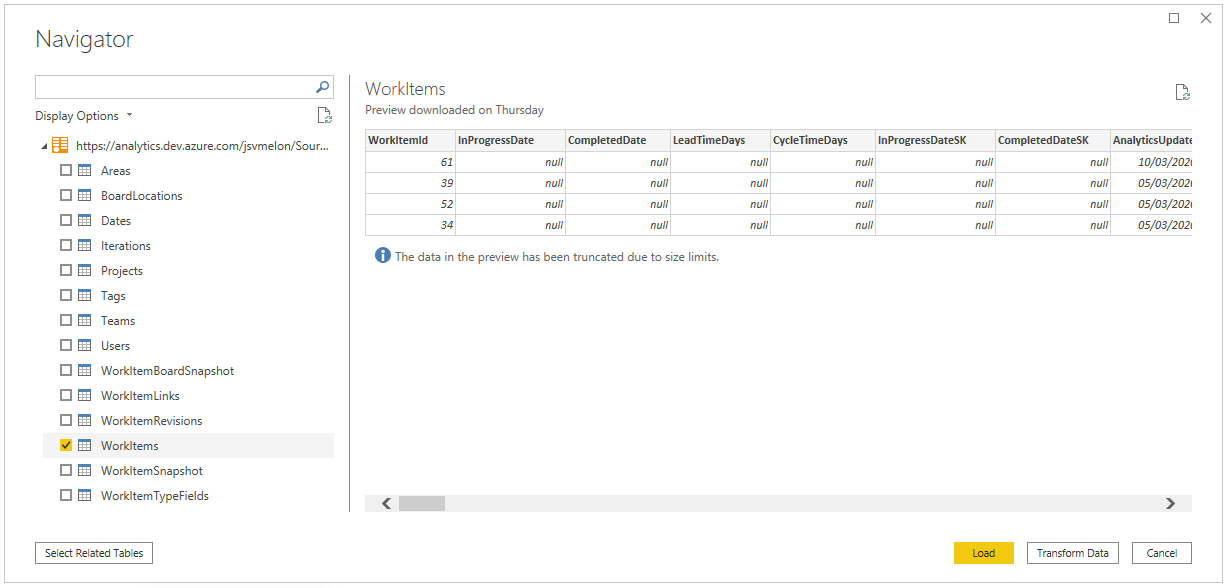
The big advantage of this approach (thanks to Sam Perridge for pointing me to this approach) is that you can select the sources you are interested in and then build your desired results with Power BI transformations instead of writing OData queries manually. To produce a Cycle Time scatter plot we just need the Work Items table as in the next screenshot. You can see in the preview that there is already a column for Cycle Time (it is null in this case as the work item in the preview has not been completed).
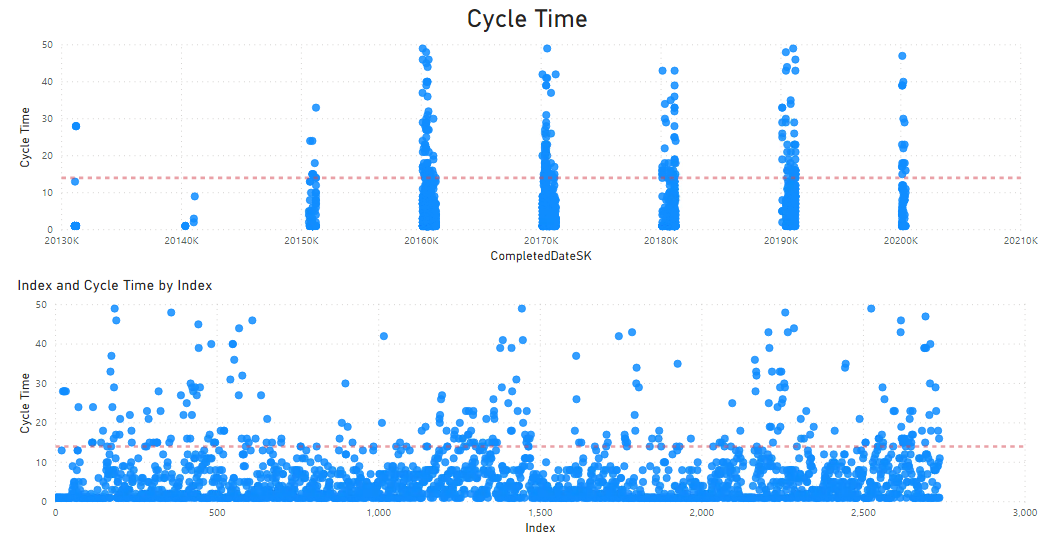
A Cycle Time scatter plot simply puts a dot for each completed work item on a chart with Time on the x-axis and Cycle Time on the y-axis. Unfortunately, Power BI scatter plots don’t play well with a non-numeric value on the x-axis. The simple workaround is to use the field CompletedDateSK instead of CompletedDate. The SK variant is a numeric value using a yyyymmdd format. If your data covers a large time frame you will notice regular gaps created by the fact that the date number format never has values in certain intervals, e.g. there are no values from 20191232 to 20200100. If you don’t like the result you can also sort by CompletedDate and create a new index column to use for the x-axis. You won’t see the dates anymore and you will never have multiple y-axis values for any given x-axis value but that doesn’t stop you from using percentiles for single-item forecasting or analysing the shape of the plot to detect potential problems like an opening cone towards the right indicating Cycle Time lengthening.
Connecting Power BI with Jira
There are a couple of options when connecting to Jira: We can use a third-party tool like the CData or AIO connectors that I have tried or we use Jira’s own REST API. Using the connectors is straightforward and allows for loading tables together with their relationships into Power BI. Although there are significant differences between the two connectors both do the job of getting the data for Cycle Time scatter plots and Cumulative Flow Diagrams and other analytics.
So does the REST API which is free to use and does not need us to install anything in addition either locally (as CData does) or adding an App to our Jira instance (as the AIO connector does). Gaining approval for additional license cost and for installing additional software can be very time consuming - especially in highly regulated environments. For these reasons I personally prefer the REST API as it enables me to demonstrate the value of using different metrics and forecasting techniques without needing to get approvals for tools first.
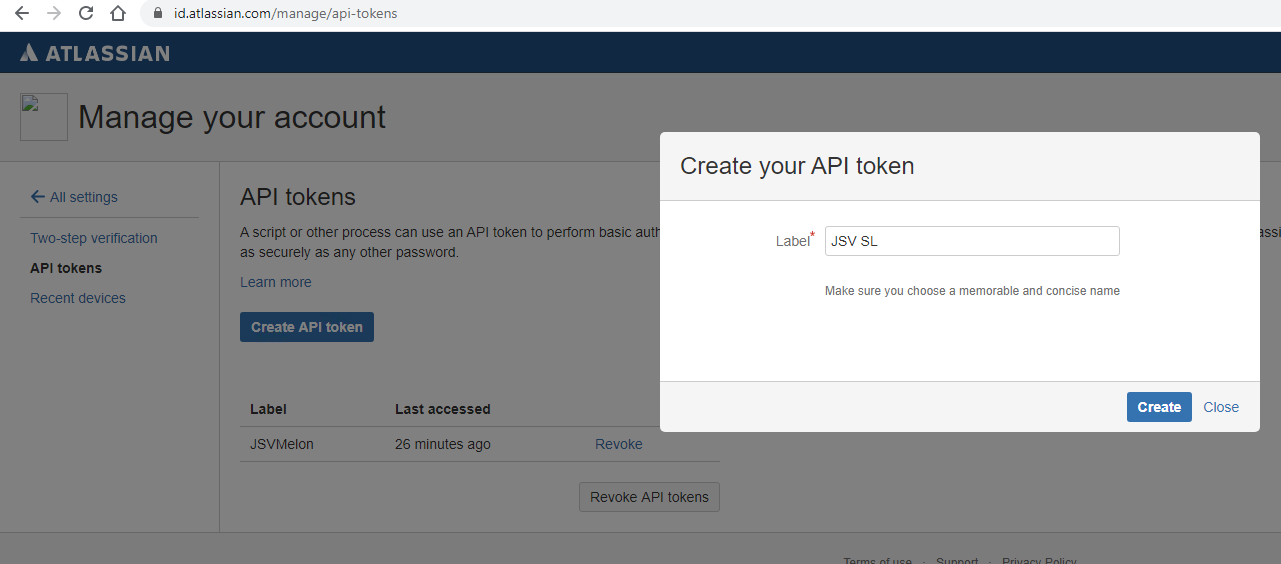
Jira API Token
With any of the connection methods, we need to generate an API token in Jira at Atlassian (the token is generated for the user you are logging in to that site). This means you need to be careful with which account you create the API token as the data access from Power BI will be defined by what that user can access. This has advantages as you can e.g. share reports with people that don’t have access to Jira and disadvantages as it does not allow to share data according to different levels of access - which could be higher or lower than those of the creator of the reports.
Connecting to Jira with the CData Connector
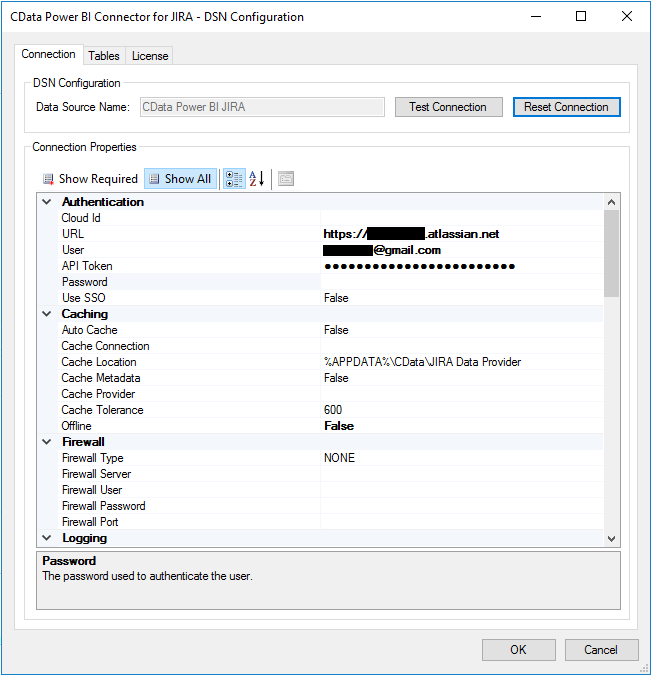
At CData you can download a 30 day trial for CData’s Power BI connector. After downloading and installing the below configuration dialogue pops up. I just filled in the URL, the email address of the user who’s token I want to use and the Jira API token.
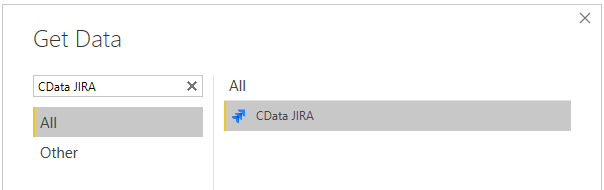
After that open Power BI (restart if it was open before), go to Get Data and search CData JIRA in the category All.
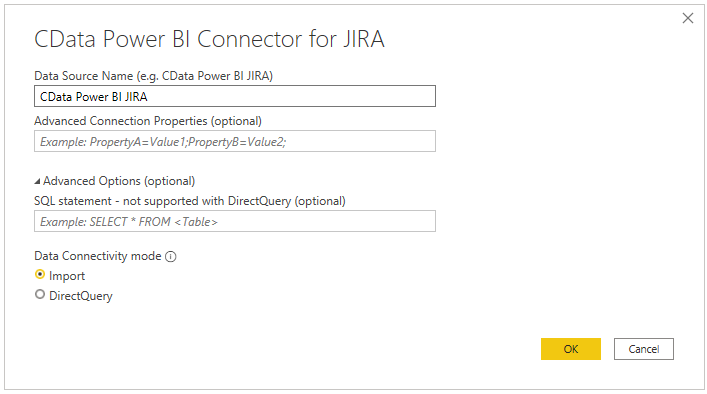
In the next dialogue, we simply enter the default name for the connector and press OK.
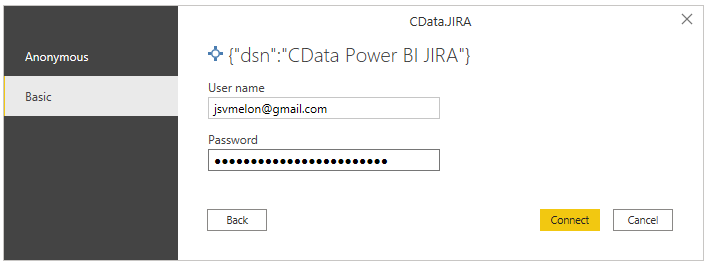
Here we insert the email address and API token for the Jira user we want to use to gather data.
After that, we get a dialogue to select the tables we are interested in. To get started you can select e.g. Issues and IssueChangelogs to get two data sources providing you with the data around Issue and all the changes to them.
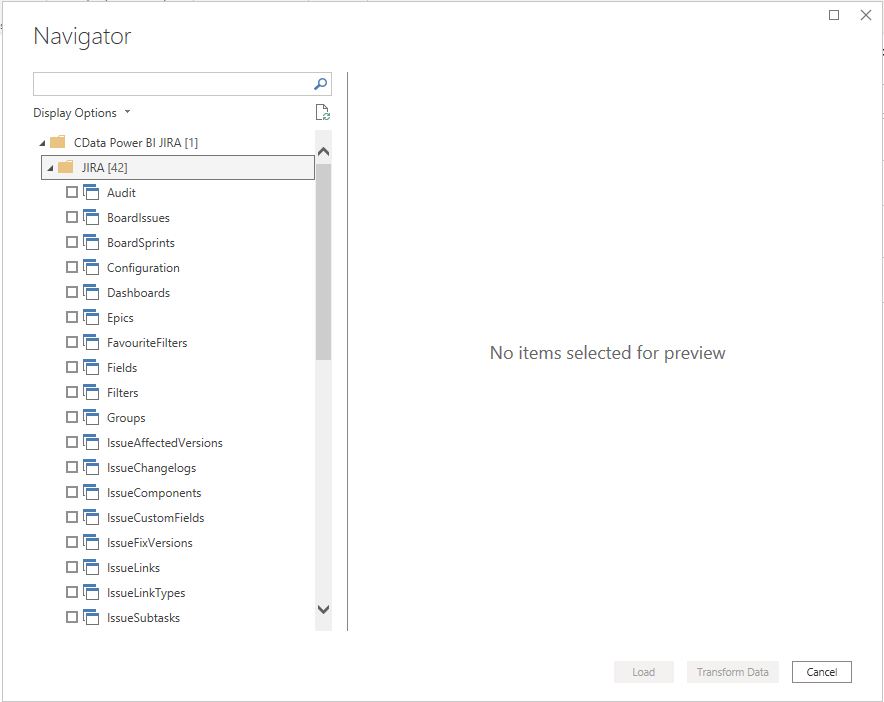
This was really easy, you can now go and play with the data.
Connecting to Jira with the AIO Data Connector
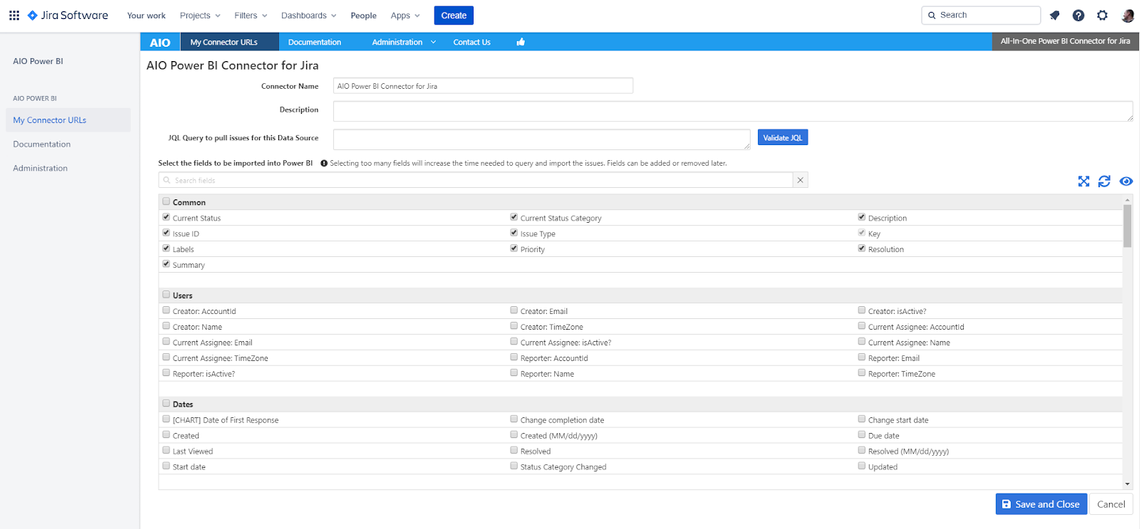
For Cloud Jira there is also an AIO connector in the shape of an App at the Atlassian Marketplace that also has a free trial. After installing the App you navigate to the Jira Software projects overview, select Apps in the top menu and select AIO Power BI. When first entering here we are presented with a screen to configure data access.
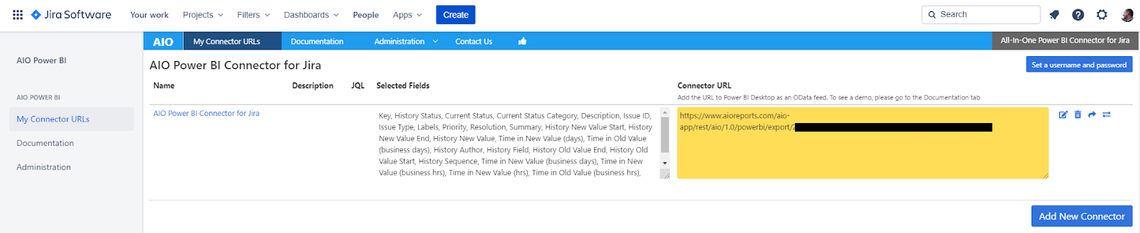
After that is saved we are forwarded to another screen where we can copy the Connector URL from the highlighted field (see below). The URL is used in Power BI to configure an OData feed (Get data, then OData as in the Azure DevOps example above). The credentials use again basic authentication with email and API Token exactly as with the CData connector.
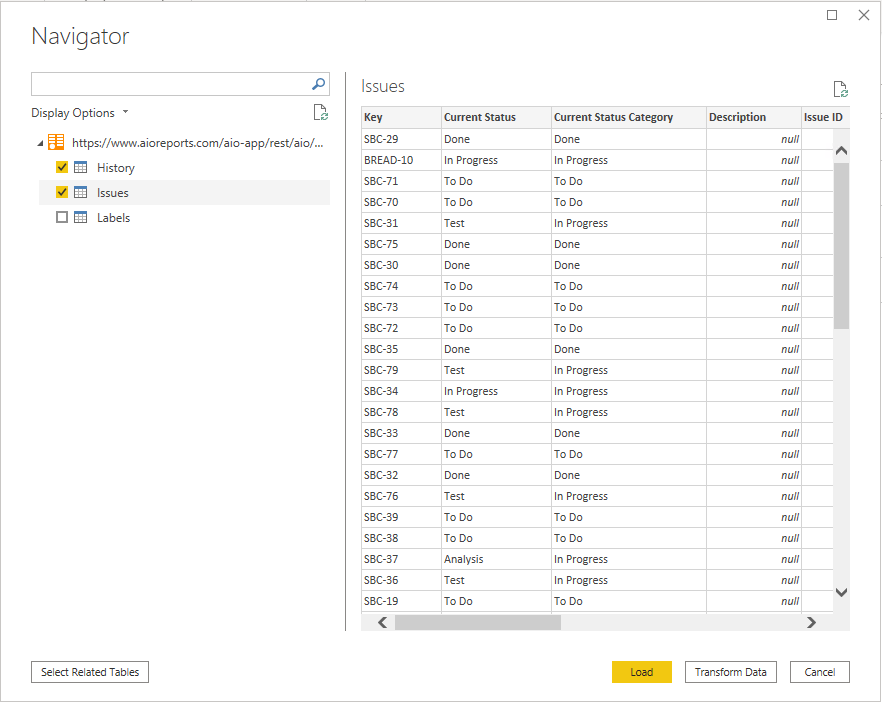
After that you are presented with the below screen to select the data tables you are interested in and that have been configured within the Jira App. You probably want to transform that data but to do some playing around you can just press Load and create your first chart - easy.
Using Jira’s REST API
It is quite straightforward to install and configure these two connectors and there are probably more available that are similar. As explained earlier the REST API has the advantage of not needing any additional installation and cost. Atlassian(this is for version 3 - if you are using a very old Jira version you might need version 2) provides a good overview of the API together with some useful examples and explanations.
However, compared with using powerful server-side executed OData transformations available when connecting with Azure DevOps the use of Jira’s REST API feels antiquated and takes a good deal more effort.
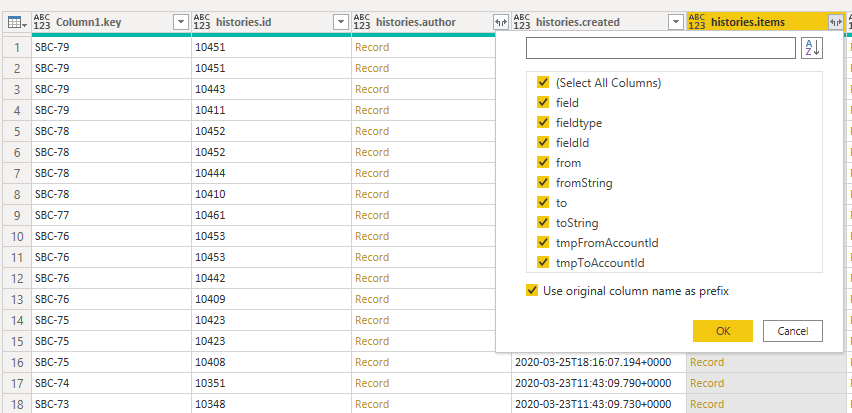
The main entry point for Issues (representing various types of work items including User Story) in the REST API is Issue search which allows to retrieve data on multiple Issues using Jira’s query language JQL. There is also a service to retrieve individual Issues but that is less interesting for the kind of analytics I am interested in. Jira’s data model is using a mechanism called expand allowing to add more information to an entity, basically drilling into the data model to an extent. For the Cycle Time scatter plots we need historic information on each Issue that is provided by the changelog entity. However, the entity Issue allows expanding into the changelog (you can see the available fields in the Power BI dropdown in the screenshot below) which removes the need to join (like we can do with tables in SQL) the two entities Issue and changelog for our specific case of a Cycle Time scatter plot.
If we need more fields from the changelog for other analytics it gets much more complicated as we need to join the data ourselves with some Power Query (or M) code within Power BI (the complete changelog can be retrieved only for individual issues).
Hence, to fetch Issues with the data needed for a Cycle Time scatter plot we can use a simple issue search query.
Making a Connection
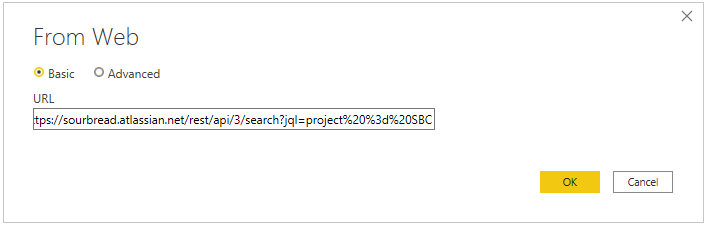
But first things first: From Power BI we now select Web in Power BI’s Get data dialogue.
For the next dialogue we need a query to connect. Let’s take a simple JQL (Jira’s built-in query language for advanced search which also used in the Jira UI) query as an example. You can type those in the browser to test, in my case it is this simple query that returns all (not really all - but more on that later) Issues in the JIRA project SBC with their changelog expanded in JSON format:
https://sourbread.atlassian.net/rest/api/3/search?jql=project%20%3d%20SBC&expand=changelog
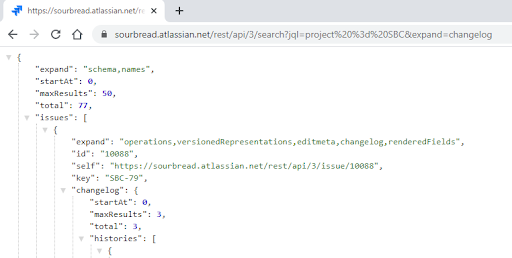
For playing with the API it is useful to use a JSON formatter extension in the browser - the beginning of the results look like the screenshot below.
This query we copy into the following dialogue.
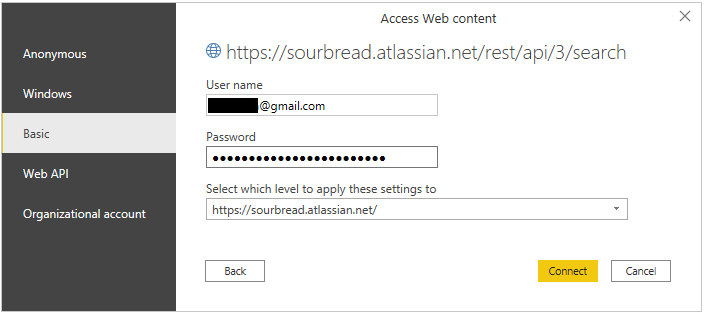
The last step is to enter the security information. Regular basic authentication with username and password is not supported by Jira anymore (if you are using an older server version it might still work). Instead, use the token we’ve created as the password and the email address of the user for which you’ve created that token (don’t use the token name as I tried in the beginning).
That’s it, we’ve connected Power BI to Jira with a simple query, Power BI is presenting us with the below result that looks deceptively simple - the entries hide in that yellow List entry. We can now use Power BI to unfold all of that data.
This data is already enough to create a Cycle Time scatter plot. Because this article is not so much about how to use Power BI I am not going into the detail here. We basically unfold, expand and filter to reveal the information when an Issue that has finished has moved from ToDo to In Progress. We then create a new calculated column containing the difference between that date and the resolutiondate field in days. That is our Cycle Time. We plot it with resolutiondate on the x-axis and number of days on the y-axis (remember my comments in the Azure DevOps connection section about Power BI scatter plots).
Result Pagination
When working with large data sets it is a usual practice to return the results in pages avoiding waiting time issues, application timeouts and accidentally overloading the API itself.
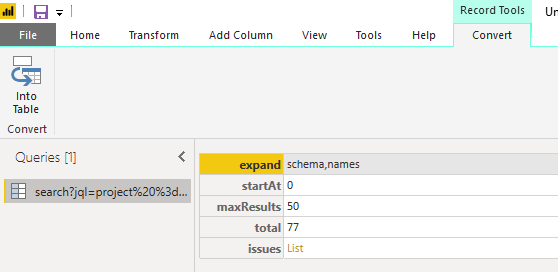
The result for the above JQL query for Jira starts with information about the result size (total), the current page start (startAt) and the size of the page (maxResults).
{
	"expand": "schema,names",
	"startAt": 0,
	"maxResults": 50,
	"total": 77,
	"issues": [
    ...
This information can be used to request all the results bit by bit. We can modify the REST API call to start at a different position by adding the startAt parameter.
https://sourbread.atlassian.net/rest/api/3/search?jql=project%20%3d%20SBC&expand=changelog&startAt=50
Programmatically we can do this in Power BI’s Advanced Editor with a little bit of Power Query code:
let
    Source = Json.Document(Web.Contents("https://sourbread.atlassian.net/rest/api/3/search?jql=project%20%3d%20SBC")),

    // getting metadata
    startAt = Source[startAt],
    maxResults = Source[maxResults],
    total = Source[total],

    fetch = (start,  resultList) =>
        if start < total then @fetch(start + maxResults, resultList & Json.Document(Web.Contents("https://sourbread.atlassian.net/rest/api/3/search?jql=project%20%3d%20SBC&expand=changelog&startAt="&Number.ToText(start) ) )[issues] )
        else resultList,

    // building the result
    issues = if total <= maxResults then Source else fetch(maxResults,Source[issues])
in
    issues
The first line makes a call to the REST API which returns the first 50 issues but also gives us the metadata needed for paging that we store in three variables. The function fetch recursively fetches all the pages and concatenates the results which are in the end returned. This logic needs to be applied whenever we fetch more than 50 records from the Jira REST API. For people who haven’t coded this is obviously not really an option (unless they’d like to learn it).
When querying an API with OData there is also pagination but for the case of Power BI and Azure DevOps the client is using server-driven paging. In this case the request returns the metadata in the shape of a link (odata.nextLink)that can be used to get the next page. Power BI implements this strategy and will automatically use the link to request the next page. This is completely transparent to the user - nothing needs to be done.
{
  "@odata.context": "https://analytics.dev.azure.com/{OrganizationName}/_odata/{version}/$metadata#WorkItems(*)",
  "value": [
    ...
  ],
  "@odata.nextLink":"https://analytics.dev.azure.com/{OrganizationName}/_odata/{version}/WorkItems?$skiptoken=12345"}
The data fetch is handled by the CData and AIO connectors internally and is again transparent to the user.
Conclusion
All in all connecting Power BI to both Jira and Azure DevOps is not too complicated and should be achievable by anyone who can deal with the complexities of using Power BI itself.
Connecting Power BI to Azure DevOps is as easy as it gets, OData data sources can be selected within Power BI, queries built by using transformations and there is no need for manually handling pagination. There is also no need for manual data joins as relationships are detected by Power BI and can be used without further manual intervention to create visuals for connected data.
Using the AIO or CData connectors for Power BI is similarly uncomplicated but brings with it some additional cost and the need to install software locally or add an App to Jira.
For technically experienced people it not very hard to use Jira’s REST API directly even when pagination has to be implemented manually and sometimes data joins have to be programmed when a simple expansion is not sufficient. After having started my own exploration by connecting Power BI with Azure DevOps and having tried two commercial connectors for Jira next the use of Jira’s own REST API feels cumbersome and is overly complicated for the needs of non-technical users of Power BI. Despite this criticism, I still like the fact that there is an integration point that can be used free of charge and is well enough document to be used by more technically minded people.