.jpg)

As described on their website “The Apache JMeter™ application is open source software, a 100% pure Java application designed to load test functional behavior and measure performance. It was originally designed for testing Web Applications but has since expanded to other test functions”. Load testing means putting an application under load by making it do lots of work, for example making lots of requests to it.
In this article, I will demonstrate how to perform a simple load test hitting an HTTP endpoint with lots of requests concurrently to simulate a large user base all using the service at the same time.
I have provided images to alongside the instructions. These capture the whole screen, but therefore make the detail hard to see when embedded in the blog. I recommend opening the images in a separate tab (right click and select “Open image in new tab”) in order to see the detail.
JMeter UI
After downloading JMeter (I’m using v5.4.1 for this post) and adding it your PATH environment variable, the JMeter UI can be opened from the command line by running the command jmeter. It will look something like this:
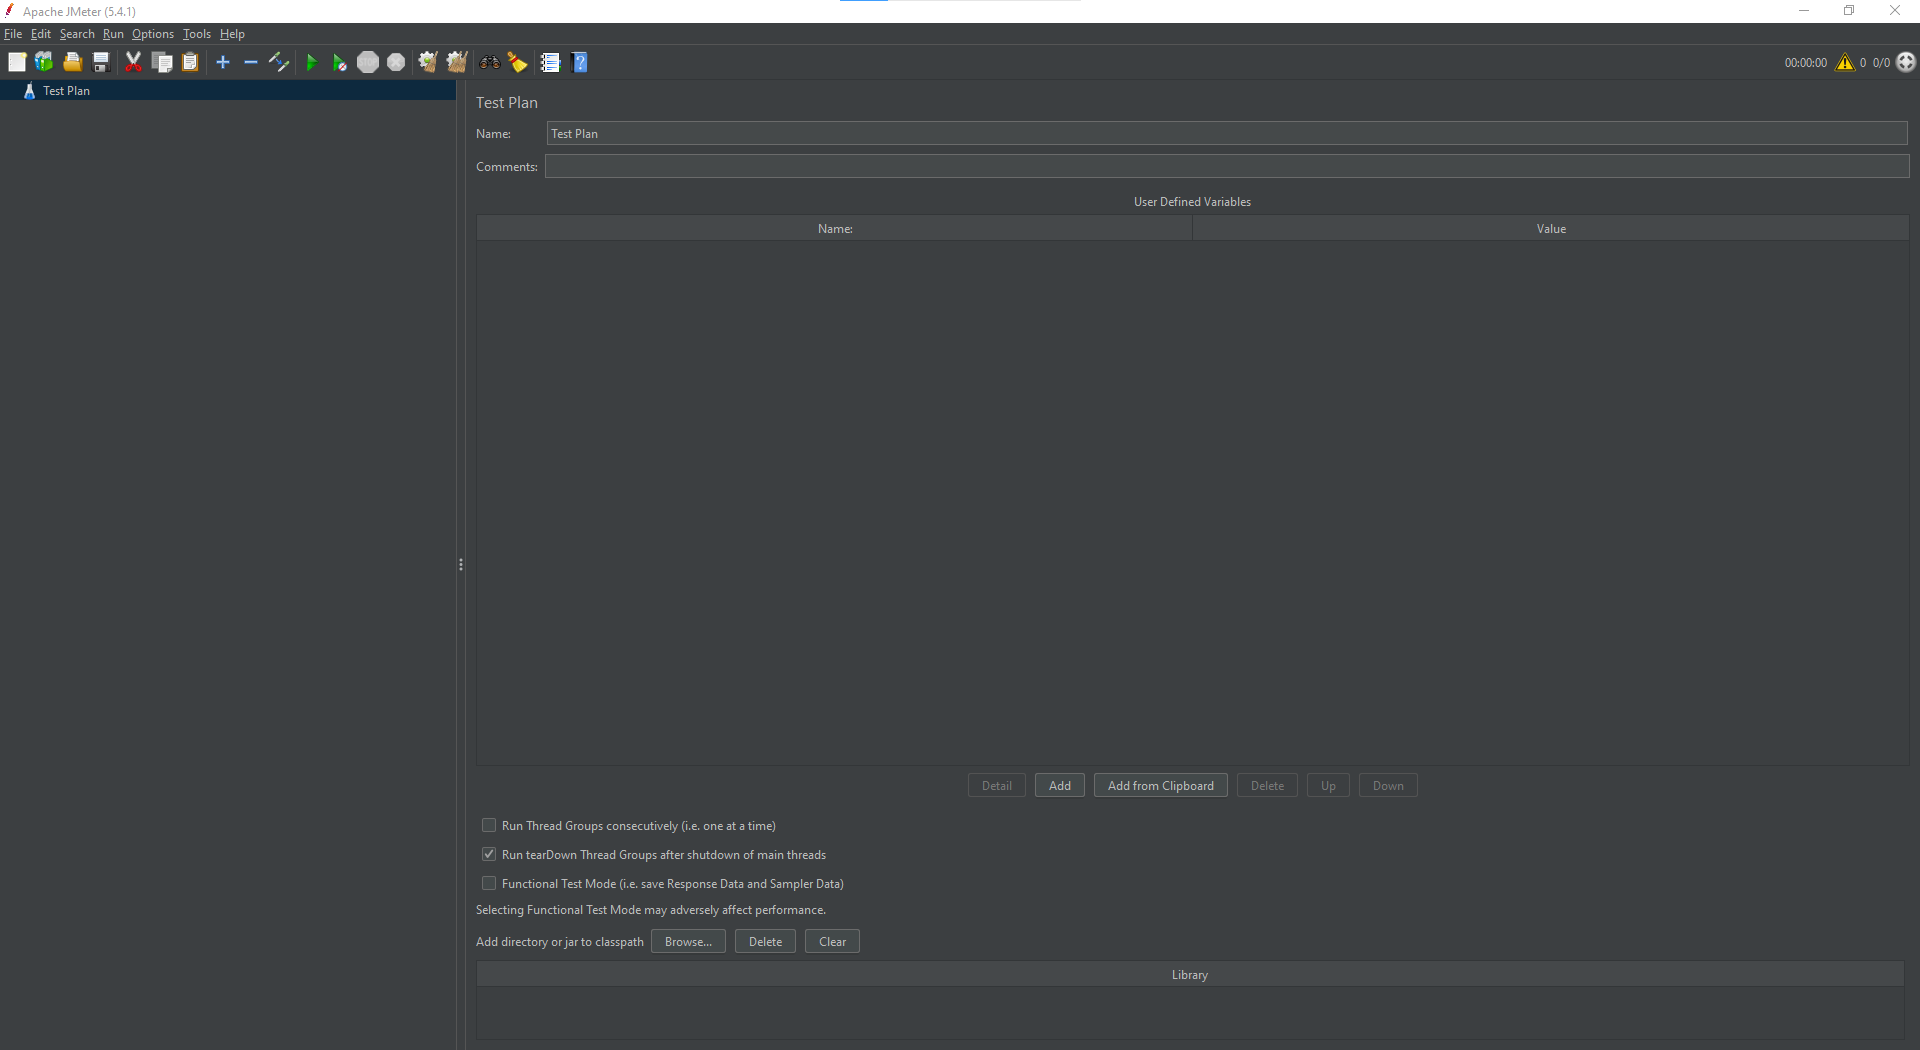
Created for you and displaying in the pane on the left-hand side is a test plan. This is the top level component of a JMeter test, and is largely a container for other components with some configuration options which we won’t touch for this simple load test.
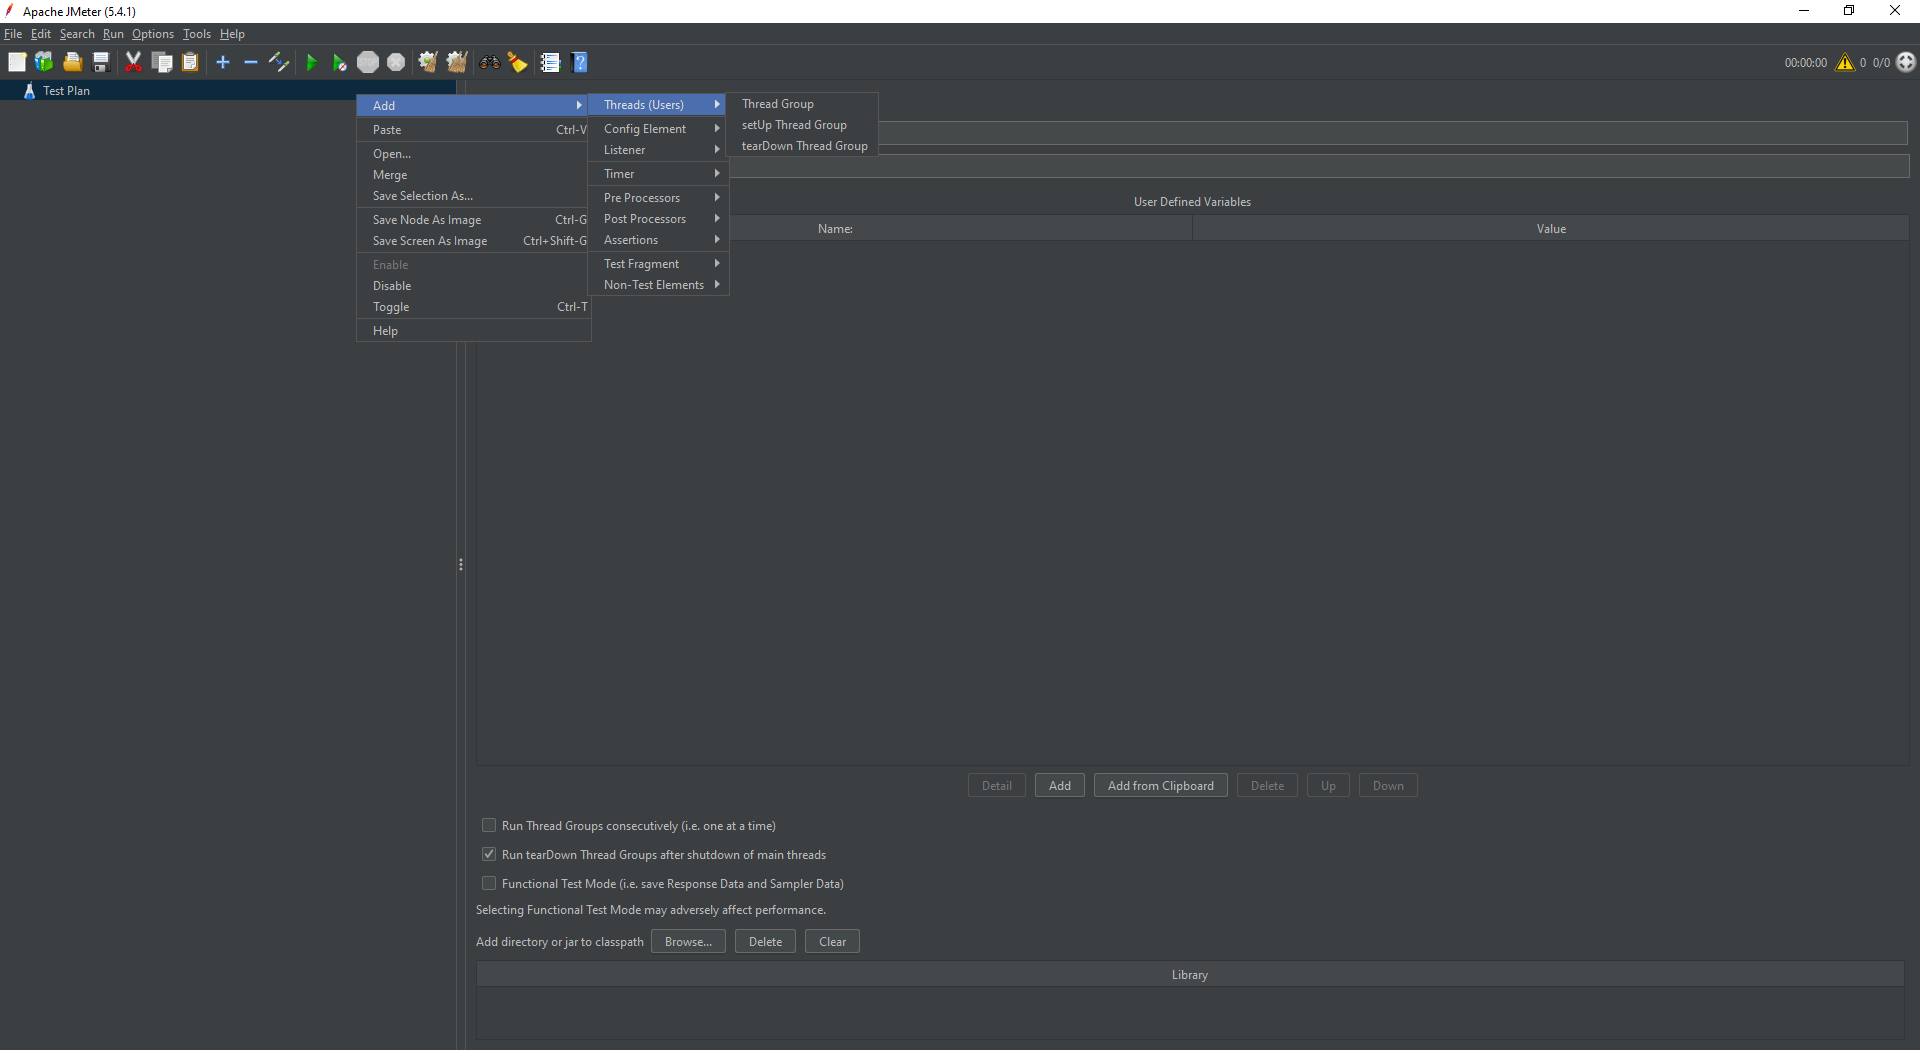
One of the advantages of the JMeter UI is great discoverability of all the different options for testing. Right clicking on the Test Plan item in the pane on the left then hovering over the add sub-item opens up an options menu showing all the items you can add to the test plan.
Thread Group
In this example we will add a thread group to the test plan from the submenu item “Threads (users)”. A thread group allows you to simulate multiple users by instructing JMeter to spin up multiple threads to run a given test case concurrently. Selecting the created thread group in the side pane, I can see in the main pane several options to configure the thread group. There are three main ones:
- Number of Threads - this is the number of threads, and will be the number of simulated users using the service concurrently.
- Ramp-up period - this is the number of seconds JMeter will take to spin up all the threads. It is recommended in the documentation that this is equal to the number of thread groups initially, and you can fine-tune from there.
- Loop count - this is the number of times the specified test will run on each thread before the test plan finishes.
For example to simulate 10 users simulataneously hitting the server’s endpoint 100 times each, set the number of threads and the ramp up period to 10, and the loop count to 100.
Right clicking on the thread group on the left will bring up an options menu. Hovering over the add sub-item brings up a list of all the different items you can add to the thread group for different test cases.
HTTP Request Sampler
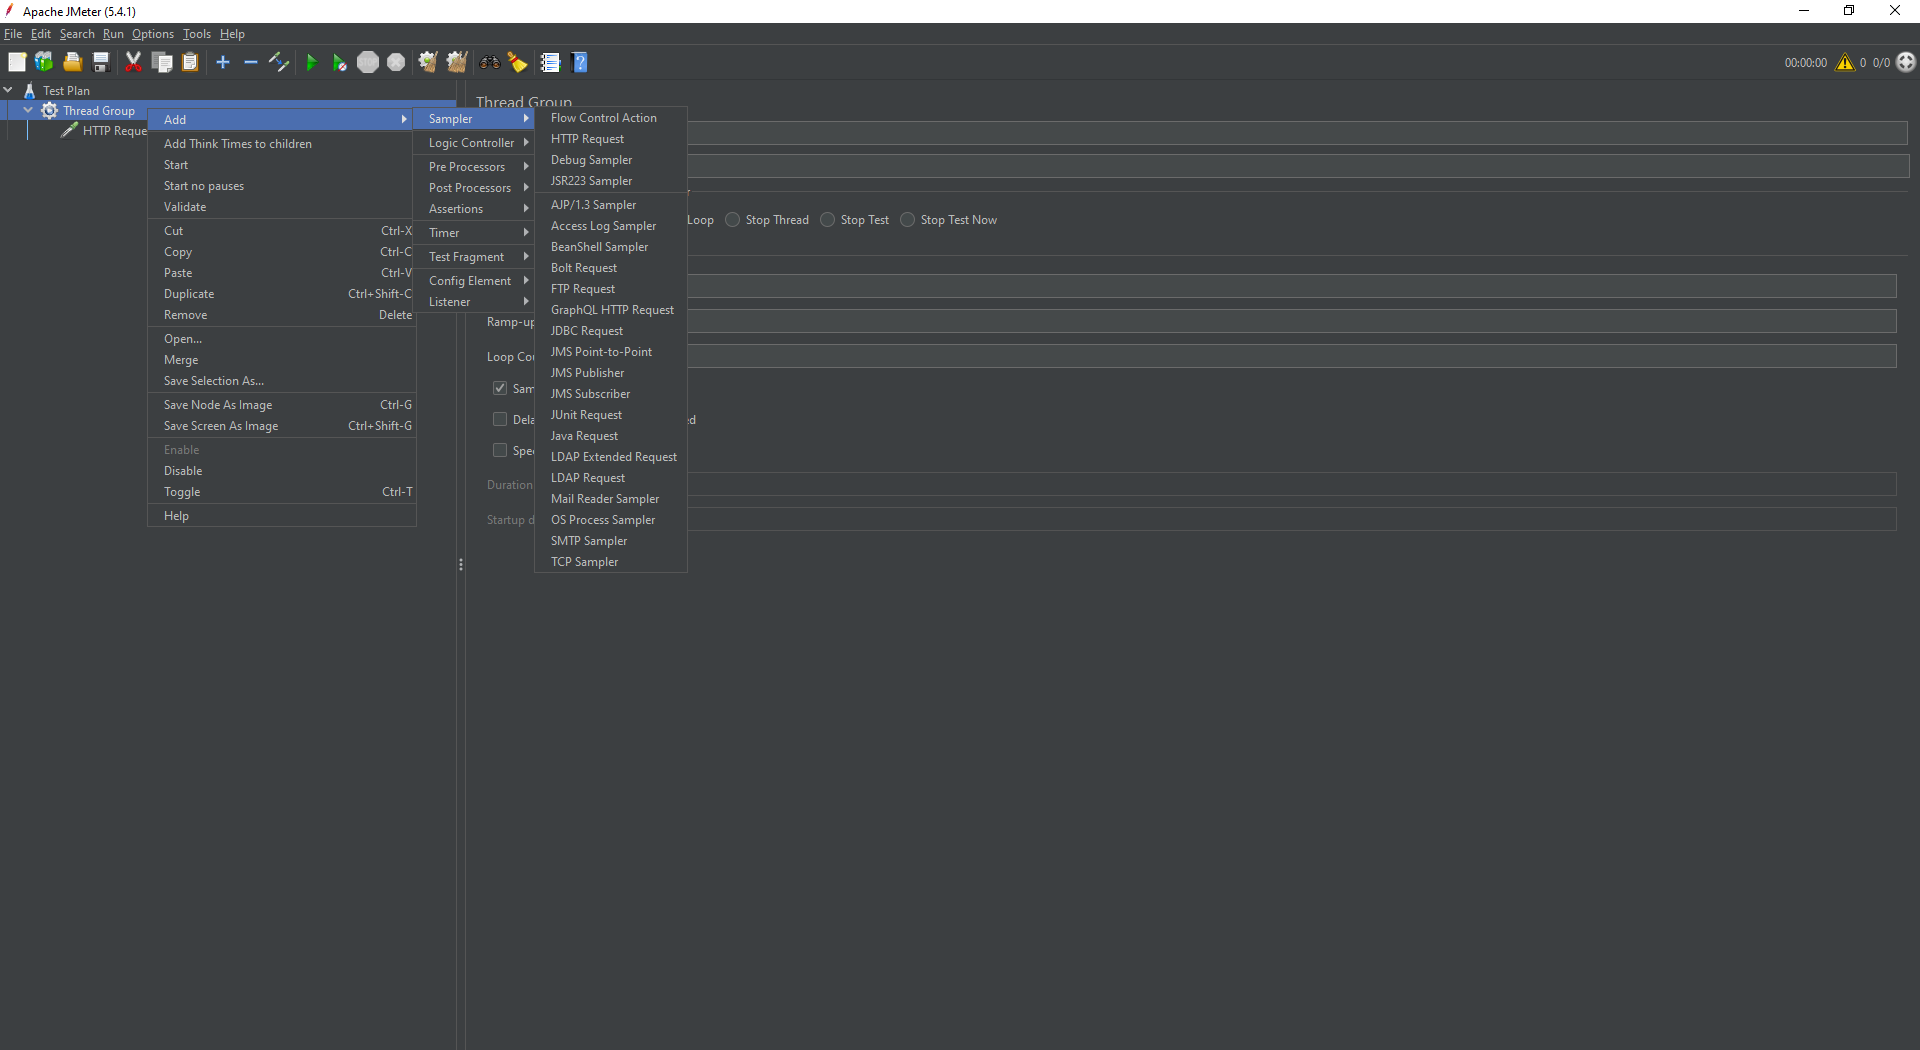
In this post, all we need to add to the thread group is a sampler. A sampler is an instruction to send a request to a server, and different samplers correspond to different protocols used to send the request. Hovering over the samplers sub-item will open the list of available samplers which can be added to the thread group. We will add an HTTP Request Sampler for our test case.
Now we have to fill in the details for the HTTP request we want to make from each thread in the load test. Clicking on the HTTP request sampler on the left opens up the details of the sampler in the main pane of the UI.
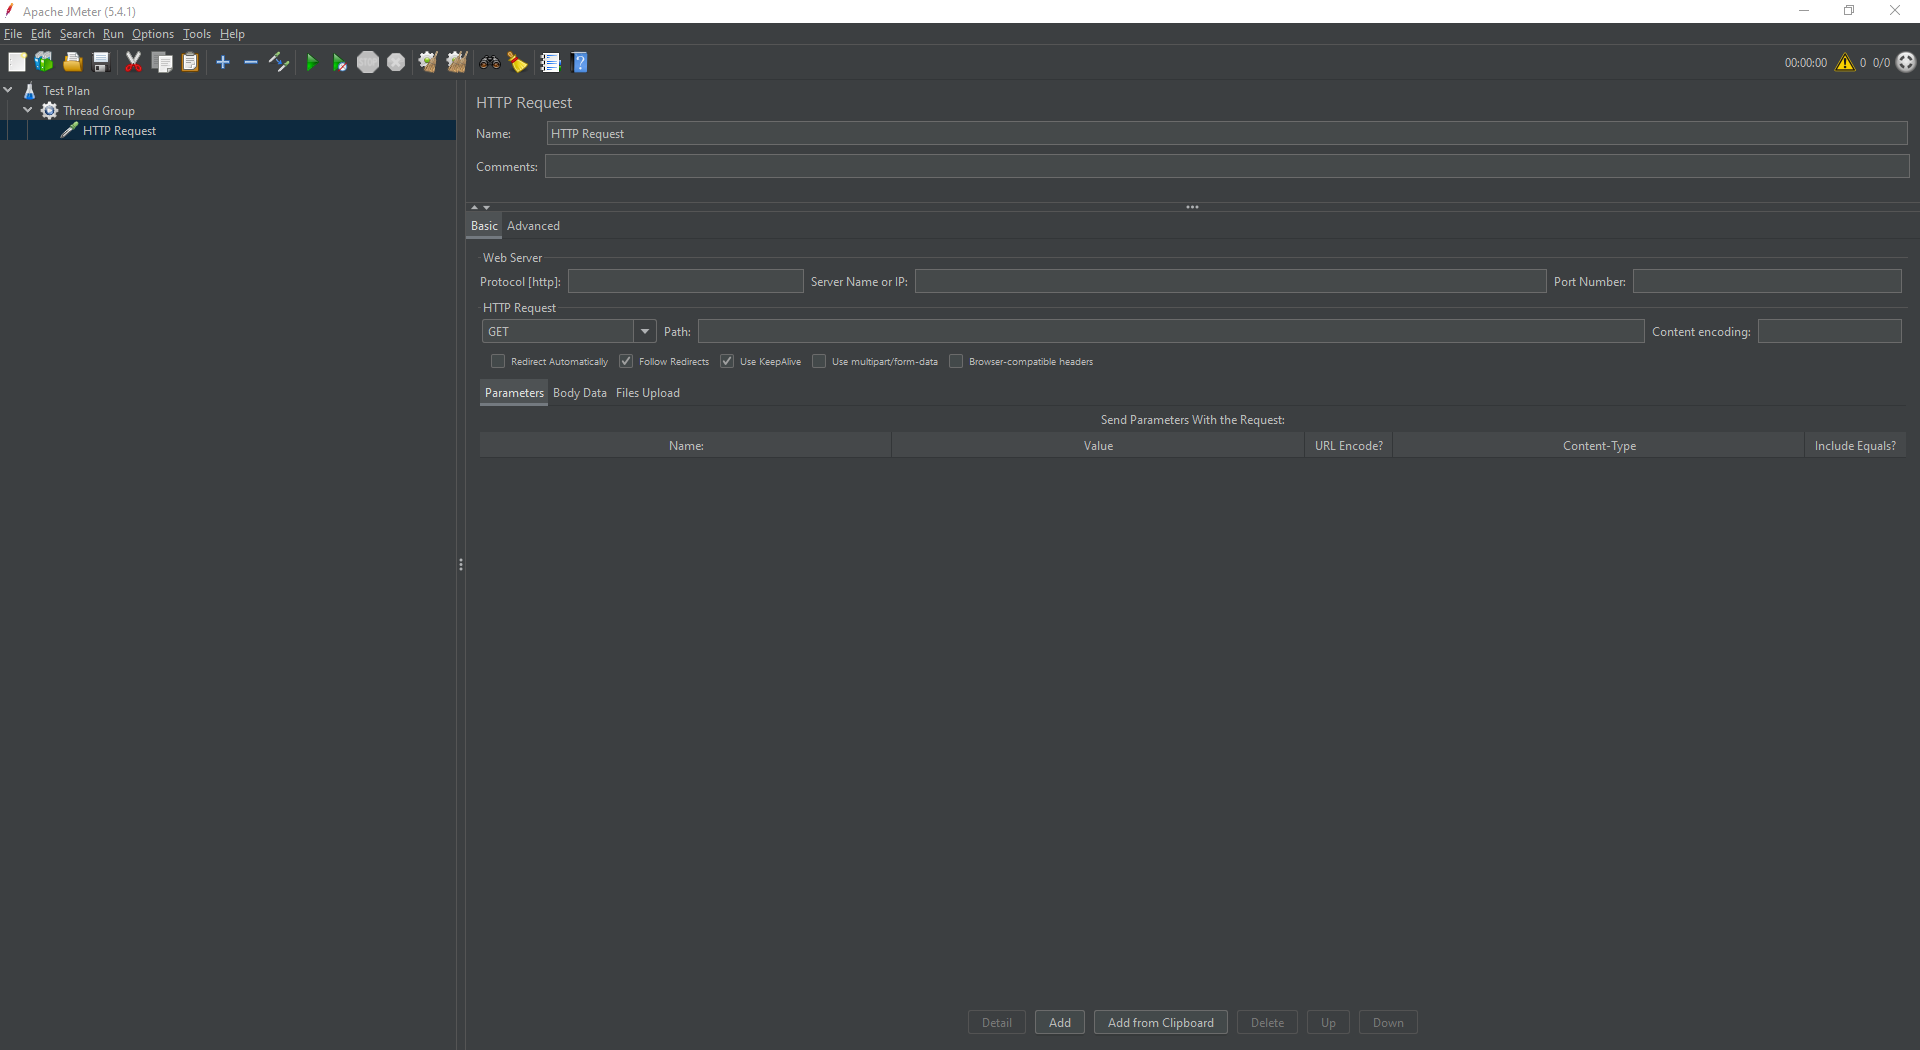
Let’s say we are trying to access a resource at http://www.example.com/resource. We will need to enter http in the protocol section, www.example.com as the Server Name, resource as the path and GET as the method. There are plenty of other options to accommodate more complicated requests that we won’t use, including port number and parameters.
View Results Tree Listener
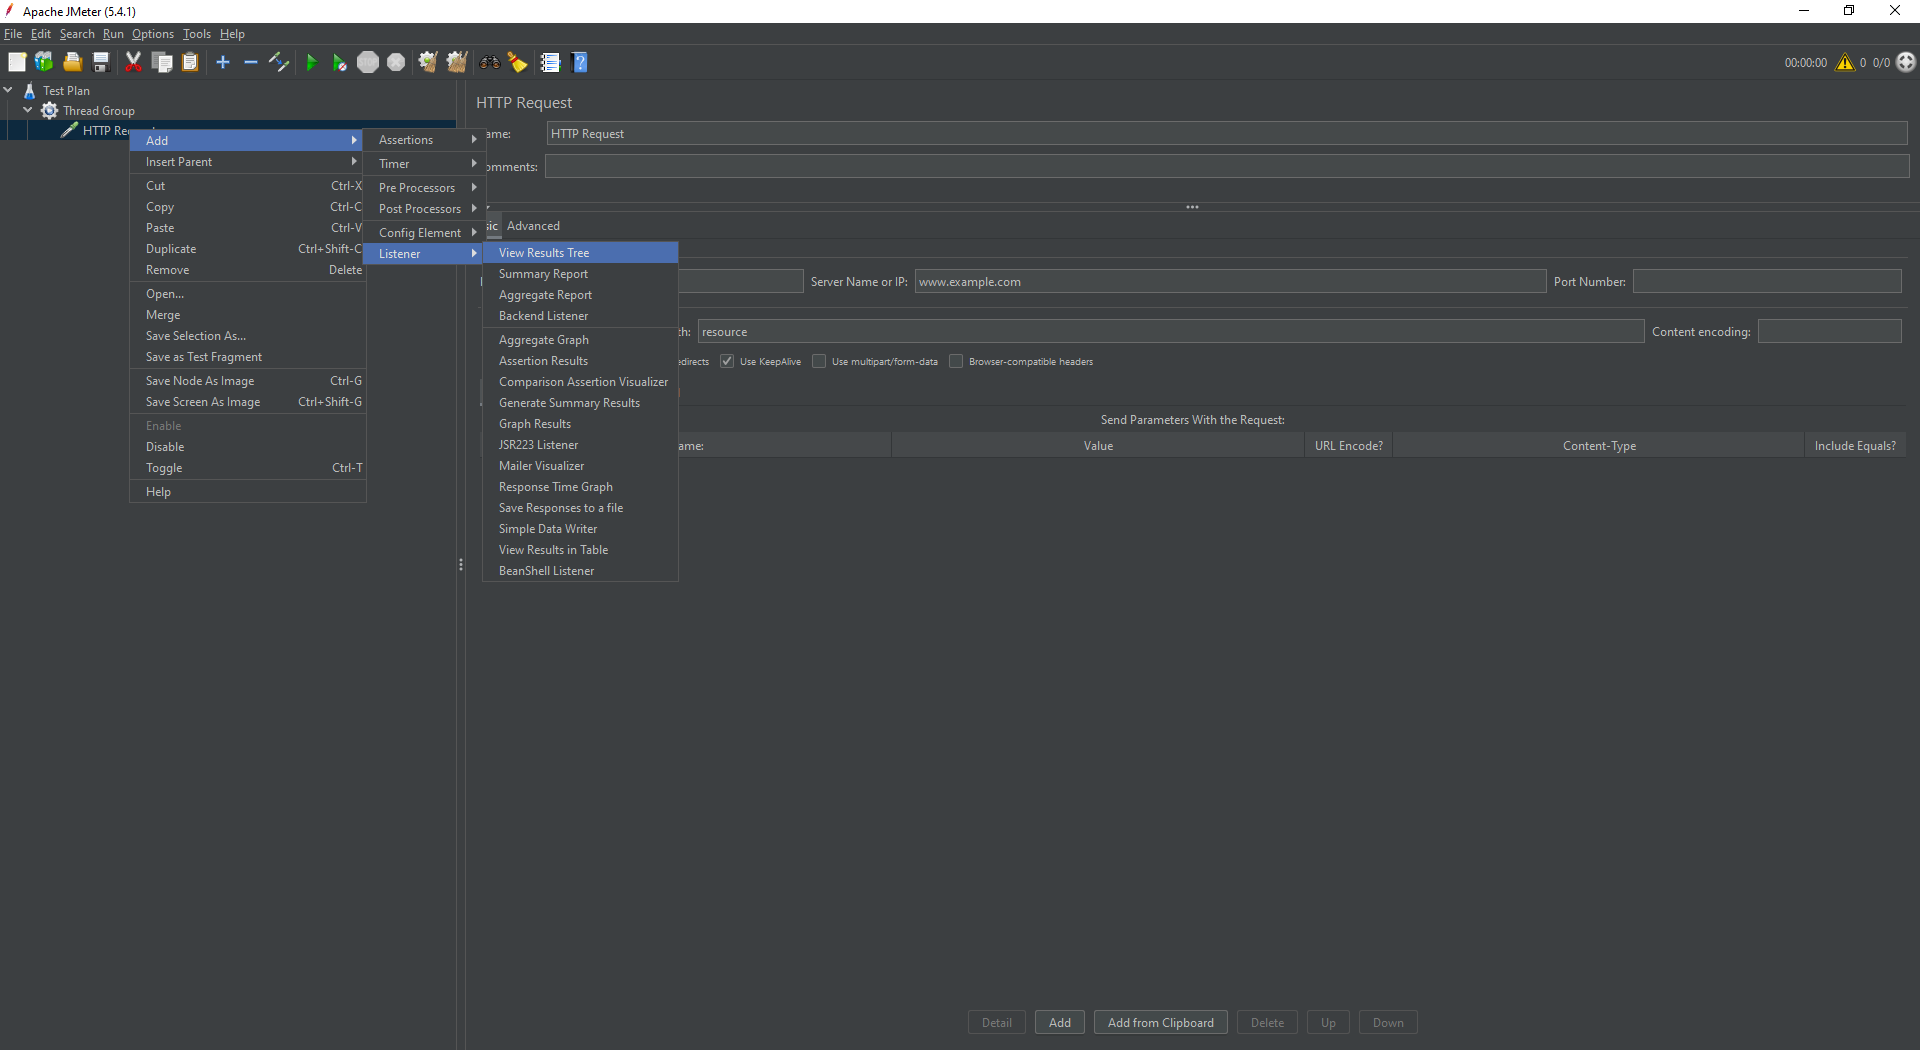
In order to ensure the test plan is configured correctly it can be helpful to add a listener to make sure the HTTP request is succeeding. To add a listener, right click on the HTTP request sampler, hover over Add, then hover over Listener and finally select View Results Tree.
We will save the test plan before running it. This stores the test plan in a jmx file, which resembles xml. It is possible to edit or add to the test plan directly in the jmx file instead of using the UI, but it can be a lot harder.
Once the test plan is saved, we can run it from the UI. We only need to make a single request to test the sampler, so it’s worth making sure at this stage that the thread count and loop count are set to 1. Clicking the play button at the top will run the test plan, and the result of the request will be output to the View Results Tree listener. This contains metadata such as response code and response data.
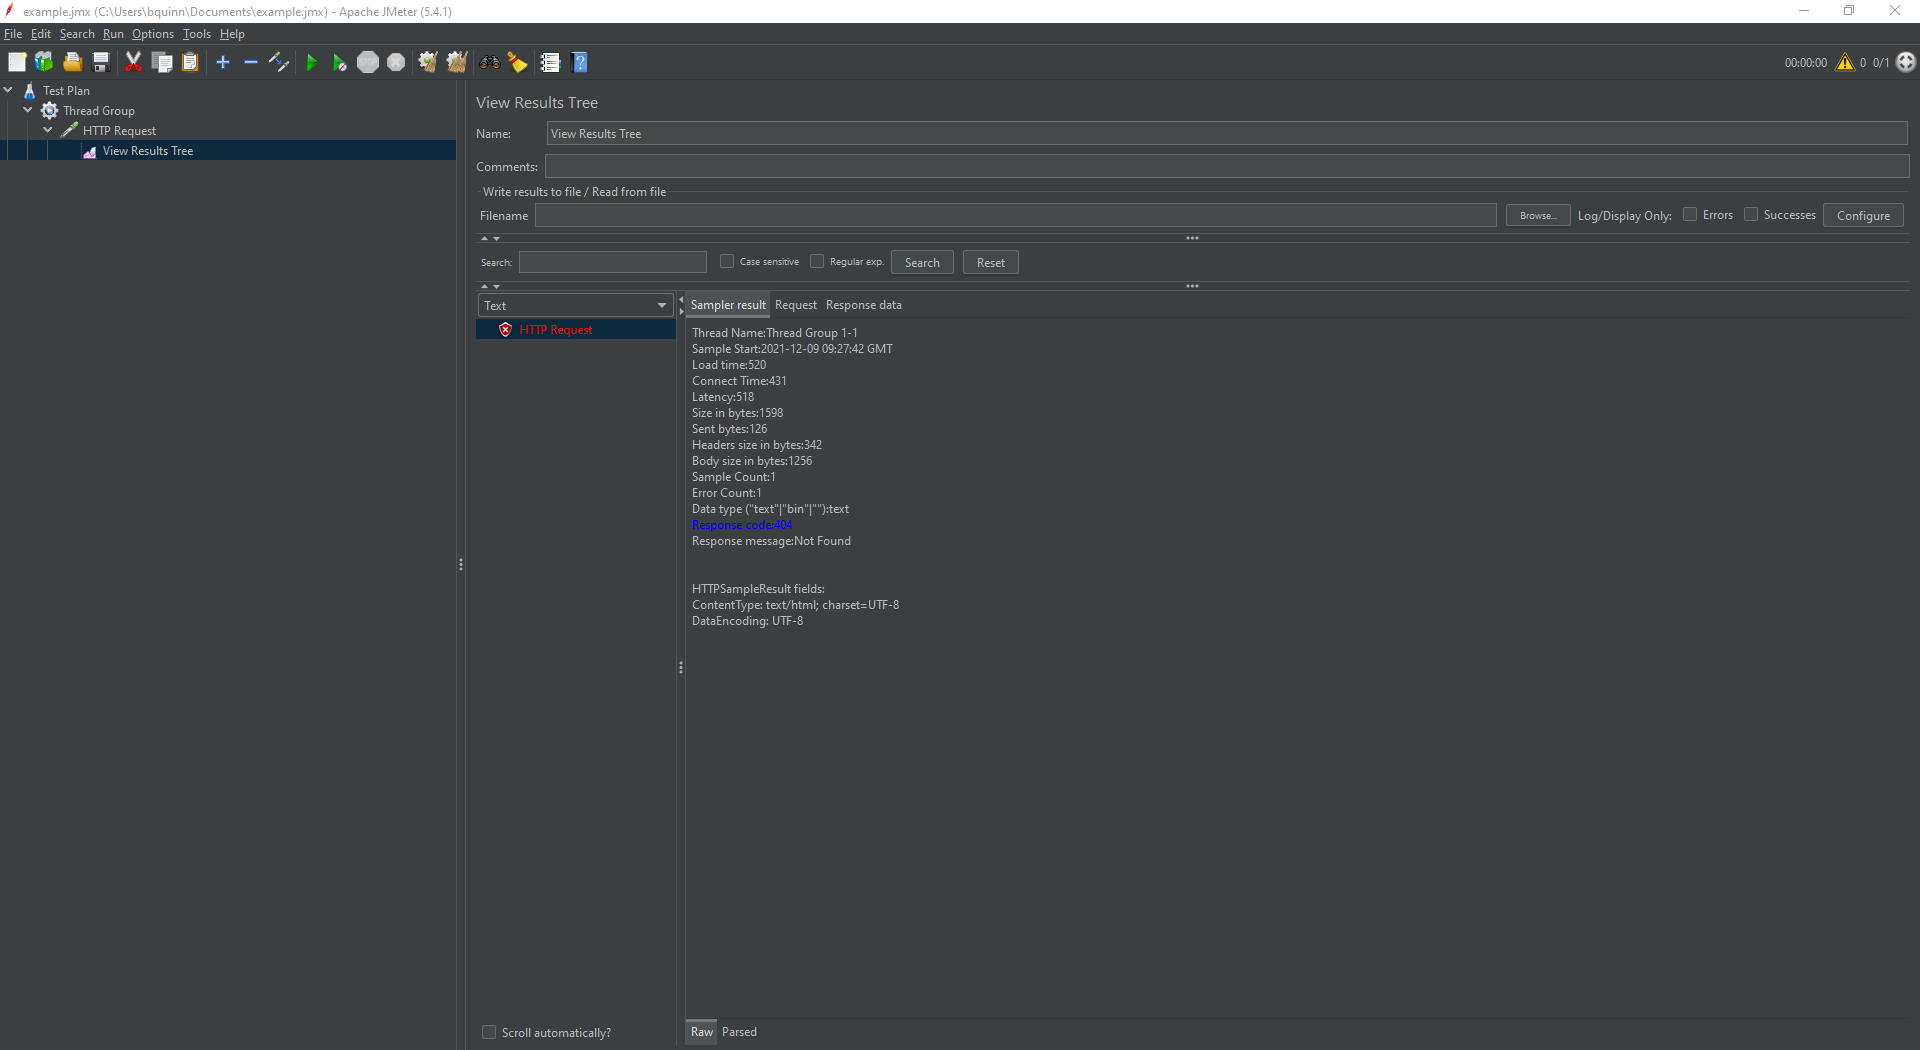
Note that because example.com doesn’t actually exist, the request fails in the image above. However, it still does a good job of demonstrating the metadata available. If you were using a real server, you would need to go work out why the request was failing.
Having confirmed that your HTTP request works, reset the thread and loop counts, or exit the UI without saving the test plan.
Running the Test Plan
The final step is to run the full test plan. Although this can be done from the UI (as demonstrated in the previous step), when running large test plans with lots of threads and loops it is better to run the test plan from the command line as it runs much slower from the UI.
To run the test plan from the command line, use the command
jmeter -n -t $path_to_jmx_file -l result.jtl
This will run the test plan specified in the jmx file and write the results to the specified result file (in this case result.jtl).
Generating a Report
The results file is a comma separated set of values, so it is possible to perform your own processing on these results. In addition, there are plenty of tools not explored in this post that will allow you to gather and analyze more data than what is done by default.
JMeter provides functionality out of the box to generate a report on the results. This can also be configured and extended which I won’t explore here. In order to generate the report automatically after running the test, run the command
jmeter -n -t $path_to_jmx_file -l result.jtl -e -o $path_to_report_folder
Alternatively, to generate a report from an existing jtl file, run the command
jmeter -g result.jtl -o $path_to_report_folder
Exploring JMeter Further
You now have a basic load test for an HTTP endpoint. There’s also a lot more you can do with JMeter. If you’re interested in finding out more, I recommend their documentation as a good starting point.