
Consider the best work you’ve done recently. Did it come from one person or department working alone in a room? I’m sure it came from people from different parts of the business getting round a table, each bringing something unique, and building something none of them could have built by themselves.
Now consider the worst work you’ve seen recently. It probably involved duplicated effort, with teams solving the same problem in different directions. Decisions were likely made with half the picture because the other half sat with someone who was never asked. In short, the result of a lack of collaboration.
Value comes from collaboration. Isolation destroys it. Everyone accepts this about people.
It is the same with data, and we need to treat it that way.
Unlocking value from your data isn’t a novel concept, nor is democratising access to data. However, it’s worth stepping back to understand what we mean by these concepts, and to reflect on how this is a journey towards releasing value, not towards the destination of a perfect, idealised system.
You can build the greatest self-service data platform in the world, but if nobody uses it, you’ve wasted a lot of time.
The data maturity spectrum
There are four stages to the data maturity spectrum, with a direction of travel towards democratisation:
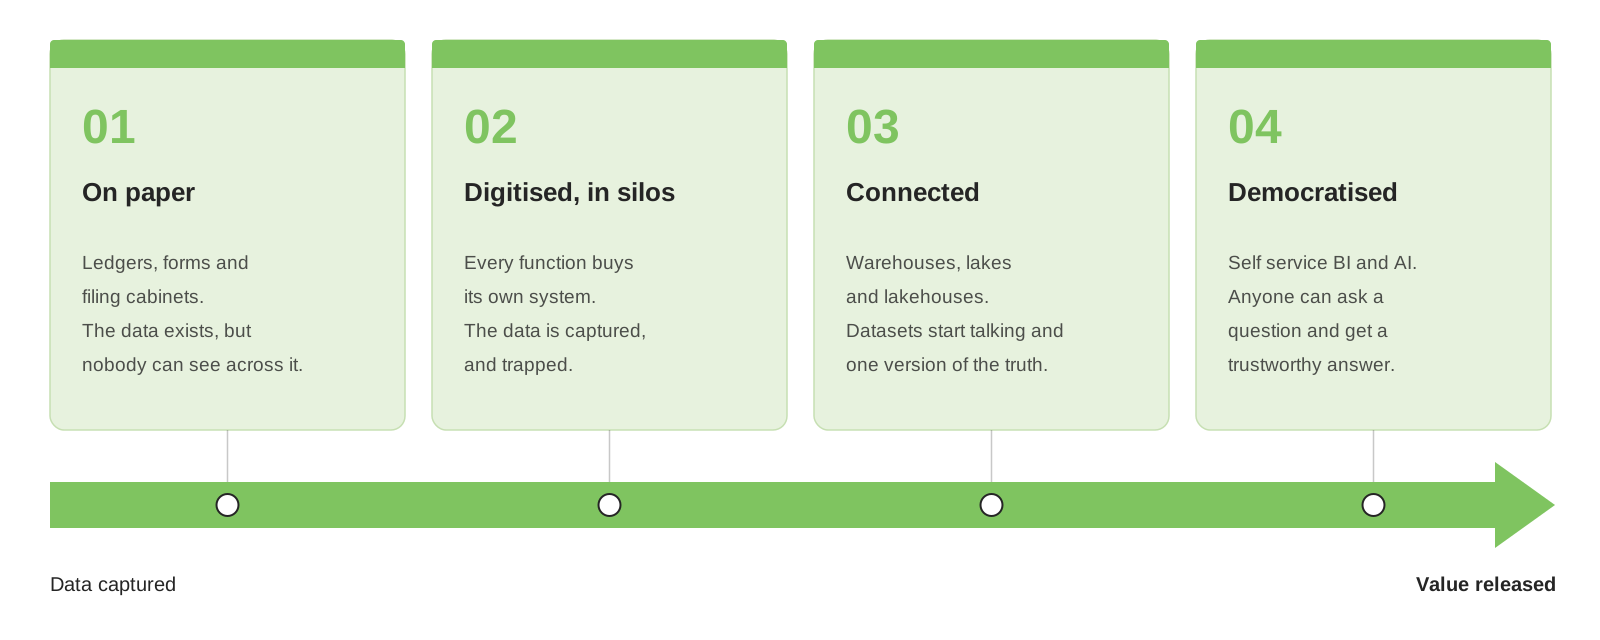
Image created by Claude
On paper. Ledgers, forms, filing cabinets. The information existed but only one person could hold it at a time. Reporting meant someone counting things by hand. We often forget this is where data started and often still sits.
Digitised, in silos. Systems arrived, and each function bought its own. Finance got an off-the-shelf package. HR bought multiple systems for different areas. Operations grew something bespoke. Each one solved a problem, and each one quietly built a wall. The data was now captured and trapped.
Connected. Warehouses, then lakes, then lakehouses (I vote for reservoir cottages next). We started pulling data out of those systems and putting it somewhere it could work together. This is where the single version of the truth comes from, and it is the point at which data stops being a record and starts being an asset.
Democratised. Self-service Business Intelligence put a dashboard in front of anyone who wanted one. AI has gone further, because you no longer need to know how to build the query. You ask a question in plain English and get an answer.
Most organisations I engage with are somewhere between ‘Digitised, in silos’ and ‘Connected’. They have the systems. They have some reporting. What they do not have is collaboration between their datasets.
What unlocking value really means
The value in your data is rarely sitting inside a single system waiting to be found. Your finance system already tells you what you spent. Your CRM already tells you what you sold. Systems were built to answer their own questions and they answer them well.
The value is in the questions that no single system can answer.
Those questions cross departmental boundaries, and they are almost always the interesting ones. What does it really cost us to win a client? Which customers are about to leave, and what did we do to them six months ago? Can we say yes to this piece of work in three weeks’ time?
None of those questions belong to one system. They need several systems to collaborate. Break the silos down, bring the datasets together, and you find value you did not know was there. Leave the walls up, and that value stays invisible; not because it isn’t there, but because the walls stop people seeing how the pieces fit together.
The challenge is no longer usually about moving the data. Modern platforms make it relatively easy to join datasets together. The harder problem is agreeing what the data means. Finance, sales and operations may all have the concept of a client, but they’re often not the same thing. One department’s active client might be another department’s prospect. One team’s margin calculation might differ from another’s. Connecting data is a technical exercise. Creating a shared understanding of that data is an organisational one.
This is why many data programmes stall after building the platform. The data is available, but confidence in the answers remains low because people do not trust that everyone is working from the same definitions. Increasingly, organisations are addressing this through semantic layers, knowledge models and shared business vocabularies that sit above the data. These provide context, define meaning and allow people, dashboards and AI systems to speak the same language.
Put simply, the challenge is not just bringing data together. It’s helping people agree on what it tells them.
An example from our own business
We run three separate systems relating to our people. Our talent acquisition system holds our hiring pipeline. Our talent operations system holds our employees, their roles and their history. Our operations system holds who is on what engagement, when they roll off, and what they are billing.
Each system is fine on its own. Each one answers its own question well. But individually, none of them can answer the questions our business cares about. What if I want to know who I can put onto a client engagement in six weeks, whether they have the right skills and personality, and how much they will cost?
We brought the three datasets together, and the answer appeared. We now get a consolidated view of consultant availability that includes people rolling off projects, people whose skills match the work, and people we have not hired yet, but who are far enough through the process that we can count on them. By adding the skills data, we moved from having a simple headcount and to building a capability picture.
That is the whole idea in one example. No new data was created. We did not buy a new system. We introduced three datasets that had never met, and a question we had been answering with spreadsheets and gut feel became something we could see, on a dashboard, updated in real-time, and trusted.
Democracy, and why removing gatekeepers matters
Let’s come back to the organisation analogy, because it explains the last stage on the spectrum.
Traditional organisations communicate up and down. Information travels up the hierarchy to be approved, pushed across, and then comes back down to be executed. It works, slowly, and it puts a small number of people in the position of deciding what everyone else gets to know. Organisations become dramatically more effective the moment people can communicate directly, rather than only up and down the hierarchy. The person with the question finds the person with the answer directly, without waiting for permission.
Data is no different. For most of the last twenty years, questions travelled up. You raised a request, a central team built you a report, and weeks later you got an answer to the question you had at the time you asked it. A small number of people controlled what everyone else could see.
Democratised access to data is the sideways conversation. Self-service BI, and now AI, let the person with the question get straight to the answer. That is a genuine shift in who gets to use data, and it is why this stage matters more than the three before it combined. It is not about better dashboards. It is about removing the gatekeeper. It’s about enabling innovation and allowing people to ask questions nobody else would have thought of.
Governance is what makes it safe
There is an obvious objection to all of this. If everyone can see everything and ask anything, what stops it going wrong?
Governance. It’s the dull end of data but it is essential to having a safe data environment.
Data security controls who can get to what; so, opening access to the many does not mean opening it to just anyone. Data privacy makes sure sensitive information is handled properly, and that combining datasets does not quietly create something you had no right to build. Data lineage tells you where a number came from and what happened to it on the way, so when two reports disagree you can find out why, instead of arguing. Data quality decides whether people believe the answer at all. Data ownership gives every dataset a person who is accountable for it, rather than leaving it as everyone’s problem – and therefore nobody’s.
Data governance isn’t a set of brakes. It’s the guardrails that let you move quickly without going over the edge.
Our own consultant availability view is only useful because (a) people keep their profiles current, (b) we know the right people have access to employee data, and (c) we know exactly where the data came from. Take that away and you have a fast, confident, wrong answer.
This matters more as AI enters the picture, not less. AI will happily give you an authoritative answer built on data nobody has checked. Data governance is what stands between democratised data and democratised mistakes.
And finally…
Nobody likes a blank page, and getting started is always hard. If you’re wondering how you can start to make your datasets collaborate, begin with a question your business cannot answer right now. Then work out which systems hold the pieces and go and unlock that answer.
Finally, remember that AI changes the picture, but not fundamentally. It genuinely accelerates your journey and is key to democratisation. However, it can make bad data wrong faster – so be careful.