
A few days ago Bloomberg published their list of 50 companies to watch in 2016, and for some reason they decided to publish the entire report in ASCII!
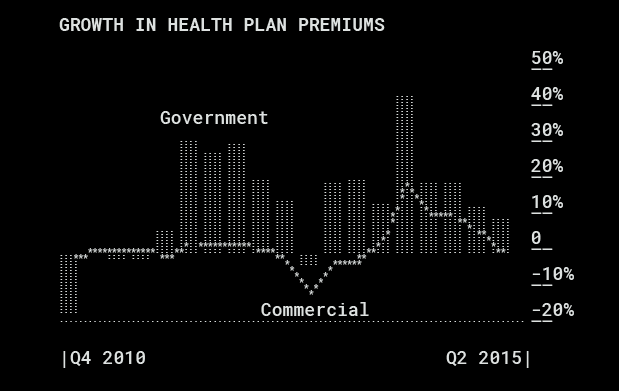
Whatever their reasons for doing so, I really like the result.
Now as I developer, when I want to create a chart or visualisation the tool I always reach for is D3, which got me wondering, could D3 be used to create an ASCII chart? A long train journey this morning gave me the opportunity to explore this question, and the answer is ‘yes’!
Here’s one of the charts from Bloomberg’s report rendered in ASCII using D3:
CHINA IPHONE UNIT SHIPMENTS (FORECAST)
Interested in how this works? Then read on …
An ASCII Canvas
HTML provides a number of different mechanisms for rendering graphics, with the most popular being SVG and Canvas. Unsurprisingly neither of these particularly lend themselves to the task of rendering ASCII graphics. From a quick Google search I did find a few frameworks that provide support for ASCII games but none of these seemed appropriate, so I decided to quickly create my own:
function AsciiCanvas(width, height) {
  var buffer = Array.apply(null, Array(width * height)).map(String.prototype.valueOf, ' ');
  var self = this;

  this.render = function() {
    var stringBuffer = '';
    for (var y = 0; y < height; y++) {
      for (var x = 0; x < width; x++) {
        stringBuffer += buffer[x + y * width];
      }
      stringBuffer += '\n';
    }
    return stringBuffer;
  }

  this.setPixel = function(x, y, char) {
    x = Math.floor(x);
    y = Math.floor(y);
    if (x < 0 || x > width - 1 ||
      y < 0 || y > height - 1) {
      return;
    }
    buffer[x + y * width] = char;
  }
}
That was pretty simple! The above code lets you define a canvas which has a single method setPixel for addressing individual pixels:
var canvas = new AsciiCanvas(5, 5);
canvas.setPixel(3, 4, '#');
canvas.setPixel(2, 2, '-');
With the canvas in place I then set about creating objects that represented simple shapes which could then be rendered against the canvas:
function Rectangle(bounds, fill) {
  fill = fill || '#';
  this.render = function(asciiCanvas) {
    for (var i = bounds.left; i < bounds.right - 1; i++) {
      for (var j = bounds.top; j < bounds.bottom - 1; j++) {
        asciiCanvas.setPixel(i, j, fill);
      }
    }
  };
}
These shapes provide a much more useable API for rendering ASCII graphics
var canvas = new AsciiCanvas(5, 5);
var rect1 = new Rectangle({
  left: 2, right: 6, top: 2, bottom: 6
});
var rect2 = new Rectangle({
  left: 0, right: 4, top: 0, bottom: 4
}, '=');
rect1.render(canvas);
rect2.render(canvas);
console.log(canvas.render());
Which yields the following:
===
===
===##
  ###
  ###
So far, so simple. The harder part is working out how to get D3 rendering to this canvas.
D3 DOM
There are quite a few ways that D3 could be used to render an ASCII chart, the simplest is to just use the D3 scales and array manipulation APIs. My colleague recently demonstrated a similar concept by showing how D3 could be combined with React. However, I personally think the data join is D3’s most powerful feature, it is what allows your documents to be ‘data driven’. I really wanted to use this feature to build my ASCII charts.
The ASCII canvas shown above is a form of immediate mode graphics, the shape primitives are throw-away, once used all that remains of them is a collection of pixels. D3 requires a retained mode graphics system in the form of a DOM, which can be HTML or SVG. A potential solution to this problem is to create a DOM structure that represents the ASCII canvas, allowing D3 to operate on the nodes, rendering the result to the AsciiCanvas.
With D3 it is possible to create elements with a custom namespace that will be ignored by the browser, Mike Bostock even has a demonstration of how this approach can be used for rendering to a HTML5 canvas. However, there is a significant issue with this approach, whilst you can create these elements by appending them to existing DOM nodes, you cannot use them with a data join:
d3.ns.prefix.custom = 'http://github.com/mbostock/d3/examples/dom';

var canvas = d3.select('#ascii-dom').append('custom:ascii-canvas');

canvas.selectAll('custom:rect')
  .data(data)
  .enter()
  .append('custom:rect');
The above code fails because the custom element does not provide the DOM traversal APIs, such as querySelectorAll, which D3 requires for selectAll among other things.
While the idea of defining custom elements for my ASCII canvas sounded quite appealing, It looks like the only solution is to use real DOM (or SVG) nodes.
D3FC Charts
With D3 and SVG I am now back on familiar territory …
The chart at the top of this post is rendered using d3fc, an open source library I have been working on recently. Here’s the code that renders the chart:
var data = [
  {year: '2014', shipments: 34000000},
  {year: '2015', shipments: 49000000},
  {year: '2016', shipments: 53000000},
  {year: '2017', shipments: 55000000},
  {year: '2018', shipments: 57500000},
  {year: '2019', shipments: 57700000}
];

var container = d3.select('#ascii-dom');

var bar = fc.series.bar()
  .xValue(function(d) { return d.year; })
  .yValue(function(d) { return d.shipments; })
  .decorate(function(sel) {
    sel.enter().select('path')
      .attr('ascii-fill', function(d, i) { return d.year === '2015' ? '#' : '=';});
  });

var chart = fc.chart.cartesian(
    d3.scale.ordinal(),
    d3.scale.linear())
.xDomain(data.map(function(d) { return d.year; }))
.yDomain(fc.util.extent().include(0).fields('shipments')(data))
.margin({bottom: 2, right: 5})
.xTickSize(0)
.xTickPadding(1)
.yTickSize(0)
.yTicks(5)
.yTickPadding(1)
.yTickFormat(d3.format('s'))
.yNice()
.plotArea(bar);

container
  .datum(data)
  .call(chart);
The code above makes use of a few d3fc components:
- bar series - this component renders the bounds data as a series of discrete bars, in the above code you can see that the d3fc decorate pattern is being used to access the underlying data join in order to highlight the data for this year.
- cartesian chart - this components combines a pair of scales and axes to create a conventional chart layout.
- extent - the
fc.util.extentutility function is a useful little component that makes it easier to compute the extent of a scale.
The above code is used to render a very small chart:
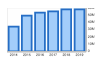
… ready for conversion into ASCII.
It is actually a very simple task to convert the SVG into the ASCII canvas shape primitives, D3 can be used to locate the various paths that the bar series generates:
var paths = svg.selectAll('.bar path');
paths.each(function() {
  var rect = new Rectangle(this);
  rect.render(self);
});
The Rectangle can be tweaked slightly to construct it from an SVG element:
function getBounds(svgElement) {
  var bbox = svgElement.getBBox();
  var transform = svgElement.getCTM();

  return {
    left: bbox.x + transform.e,
    right: bbox.x + bbox.width + transform.e,
    top: bbox.y + transform.f,
    bottom: bbox.y + bbox.height + transform.f
  };
}

function Rectangle(svgRect) {
  var bounds = getBounds(svgRect);
  var fill = svgRect.getAttribute('ascii-fill') || '#';
  this.render = function(asciiCanvas) {
    for (var i = bounds.left; i < bounds.right - 1; i++) {
      for (var j = bounds.top; j < bounds.bottom - 1; j++) {
        asciiCanvas.setPixel(i, j, fill);
      }
    }
  }
}
The getBBox function is used to obtain the bounding box of an SVG element, however this needs to be combined with getCTM which obtains the transformation matrix applied to the element. Notice also that the rectangle fill is obtained via the ascii-fill attributes.
Similar logic can be applied to render text or other SVG elements.
All that’s left is to hide the SVG which acts as the intermediate form for the ASCII canvas. If you want to play with the code here’s a JSBin.
This code is really quite hacky, but it does mean that we have all the power of the d3 data join, combined with the d3fc components - which means that creating charts with animated transitions is really quite straightforward:
The above code takes the transitions example from the d3fc example, using requestAnimationFrame to continuously convert the hidden SVG chart into ASCII. There’s a JSBin if you want to play around with this example.
So there you have it, ASCII charts rendered using D3. Not terribly useful, but if Bloomberg can do it, then so can I!
Although I’ll let you into a little secret, the Bloomberg report might look like ASCII, but for the most-part it’s actually pre-rendered images.
Cheats!
Regards, Colin E.
