Last month I downloaded the race data for the 7,190 athletes who recorded their London Marathon on Strava, comparing pacing, split times and generally finding interesting patterns in the race data. Since then I have downloaded every single run recorded in the 17 weeks leading up to the marathon for 1,000 of these athletes. The data in these 100,000 runs has allowed me to see how they trained in the weeks running up to the race - and the results are fascinating! I’ve learnt that people put in ~30% less mileage than popular plans suggest, Sunday mornings are a firm favourite for long runs, and that Saturday morning parkruns are very popular!
Weekly mileage
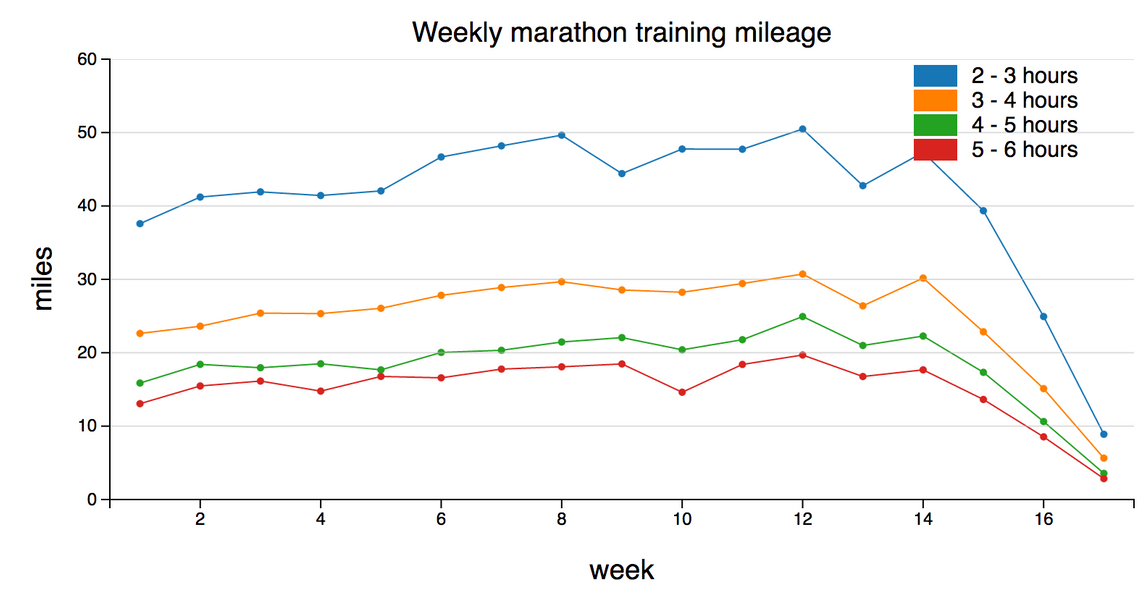
The following chart shows the average weekly mileage of athletes grouped by finish time:
(view the code for this chart)
Week 17 is the week of the marathon, and the mileage plotted in that week excludes the marathon itself.
The above chart isn’t terribly surprising, with the faster finishers putting in more miles on a weekly basis. You can see a gradual increase in weekly mileage for the first 13 weeks, followed by a 3 week taper (a period of reduced mileage in preparation for the race).
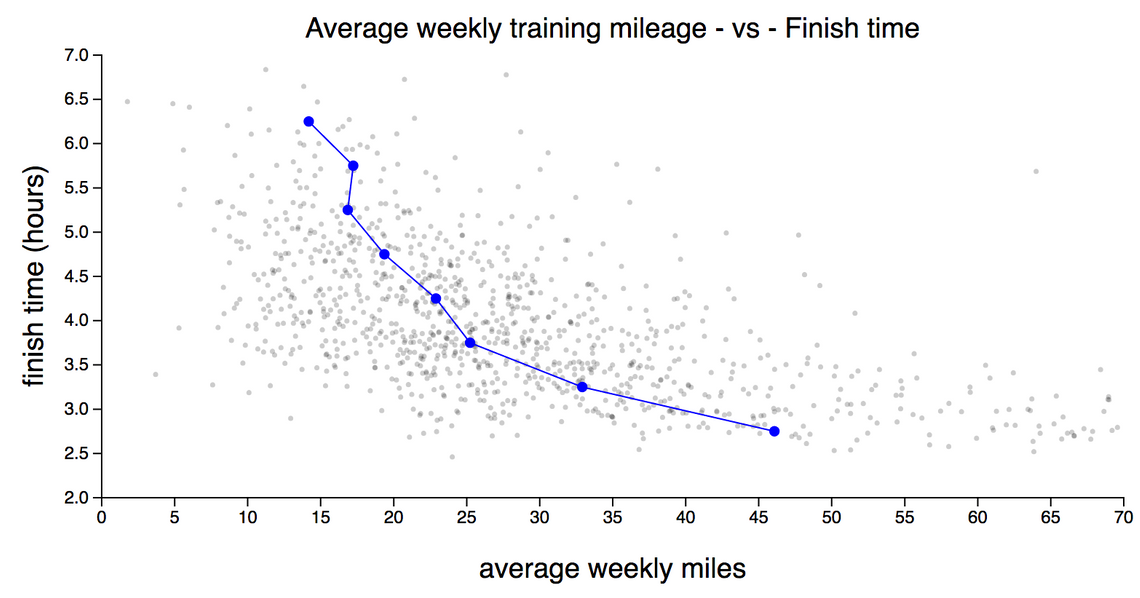
The following chart takes a closer look at the relationship between finish time and weekly mileage, with the training data from the 1,000 athletes rendered as a scatter chart. The solid line shows the average weekly miles, by finish time, bucketed by 30 minute intervals.
(view the code for this chart)
As an athlete gets faster, the benefit of adding additional training miles reduces.
Weekly training days
The following charts plots the average number of days each week that athletes log a run on Strava:
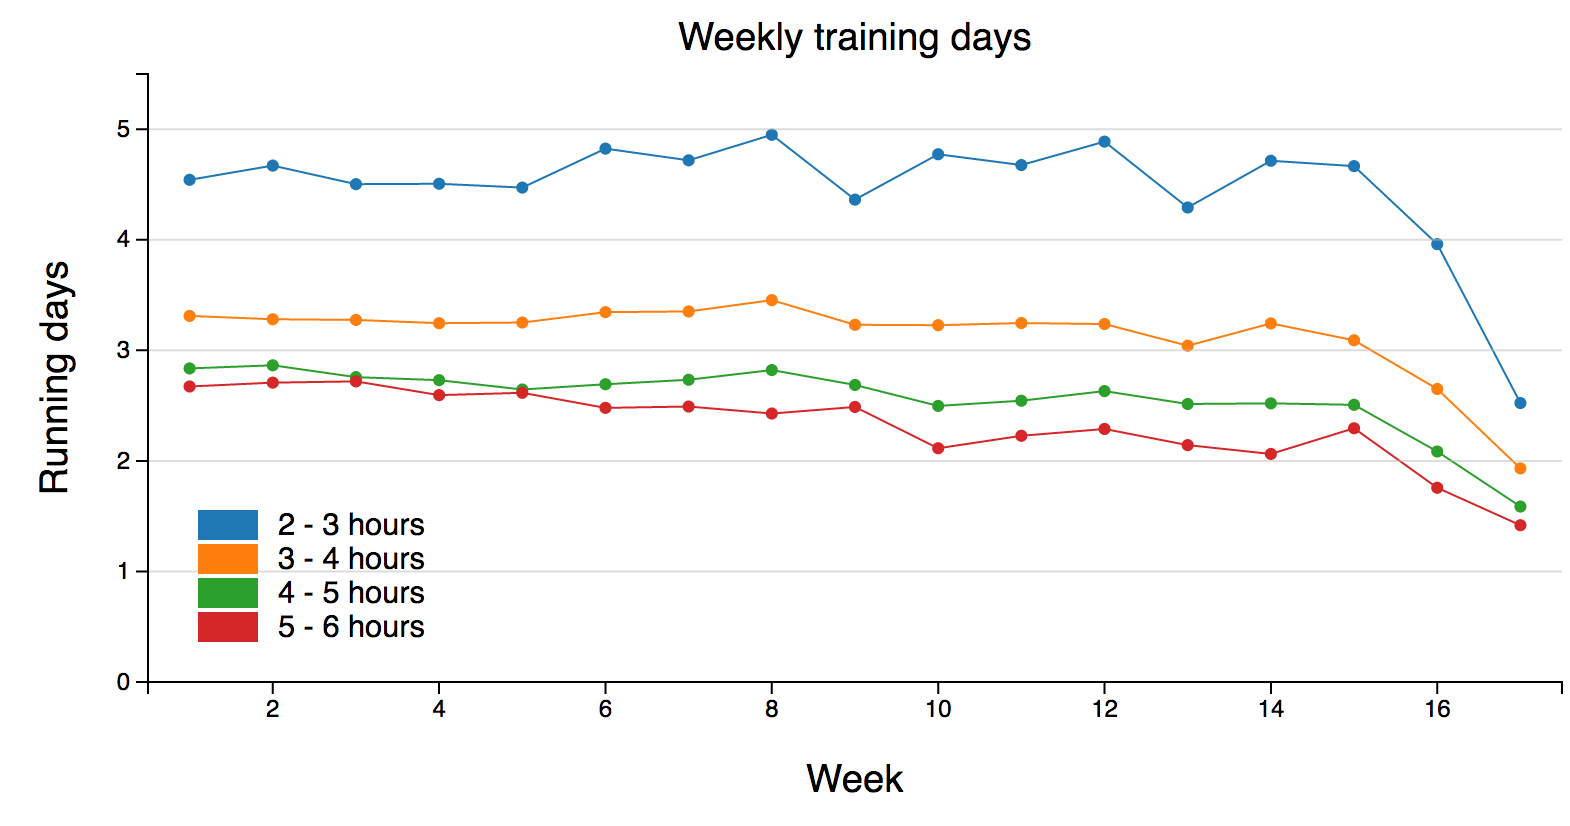
Again, it is not too surprising to see that faster runners run more frequently. However, those in the 2-3 hour finish time band only run on average between 4 and 5 days a week. This might sound like a lot, but it is less than most training programs suggest, most recommend one rest day ever other week.
Interestingly none of the athletes increase their number of training days, in fact, those in the 4-5 & 5-6 finishing bands decrease their number of weekly runs. As their overall mileage is increasing they are favouring fewer long runs over a greater number of short runs each week.
Plan vs. Reality
The results so far seem quite typical, faster runners putting in more training miles, and all athletes increasing their mileage before the taper. But how do they compare to marathon training plans?
The popular Runners World website has a ‘Big Marathon Index’, with training plans for a wide range of target finish times. I picked four of these (3:00, 3:30, 4:00, 4:30) to see how the weekly prescribed mileage differs form the way these 1,000 athletes actually trained.
The following charts show the plan mileage (these are 16 week plans, hence the marathon week is the 16th), versus the training mileage of athletes who achieved that goal by up to 15 minutes. For example the 3:00 hour plan mileage is plotted against the average weekly mileage for athletes who finished between 2:45-3:00.
The upper dotted line is the training plan mileage, whereas the solid line below is the average mileage from the Strava dataset. The filled band area highlights the difference.
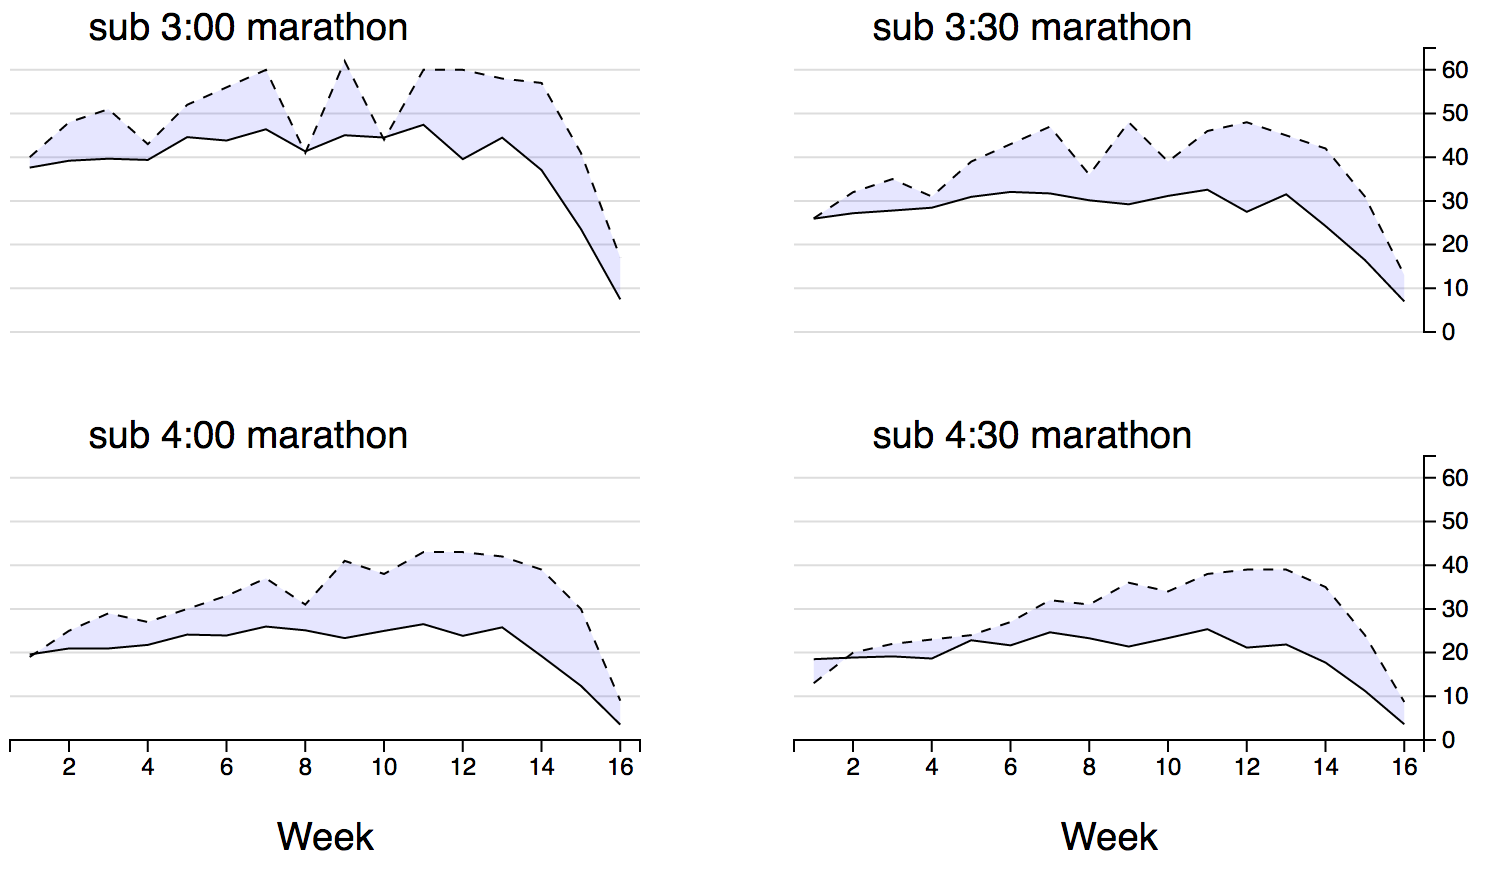
What’s immediately obvious here is that athletes are able to achieve their goals while putting in significantly less mileage in their training. Runners who achieved a sub 3:00 marathon put in on average 21% fewer miles over the 16 week period than the plan suggests (621 miles vs 790 miles). The biggest discrepancy is present in the sub 4:00 category, where the athletes are running 34% fewer miles than the plan.
This is a great result for marathon runners!
Another interesting difference is the overall shape of the weekly mileage. All four plans suggest increasing your weekly mileage by around 35% - 50% over the first 13 weeks of the plan, whereas in practice these athletes are increasing their weekly mileage by very little - approximately 10%.
One more notable difference is the mileage in the marathon week, in all cases the plans suggest putting in more than double the amount of miles.
This could simply indicate that these plans are targeted towards athletes who are aiming for a significant improvement in their finish time, and are willing to ‘up’ their mileage specifically for this marathon. Whereas in practice athletes favour steady and consistent mileage over a long period, rather than ramping up for a specific event.
Show me the code
This post is about data and patterns, rather than the code I used to find them. However, if you are interested in the details, these charts make use of d3fc, an open source library that extends the vocabulary of D3 (SVG, paths, lines, etc…) to encompass charting concepts such as series, charts, annotations, while still adhering to the D3 patterns of selections and data-joins.
The use of d3fc made it quite a bit easier to render these charts than if I’d just used D3. If you want to dig into the details, each chart has a link to its source code.
Back to the data …
When athletes train
By looking at when athlete log runs I found that Sunday was the most popular training day, however, a more detailed heatmap of runs, showing the time and day of week, reveals some really interesting patterns:
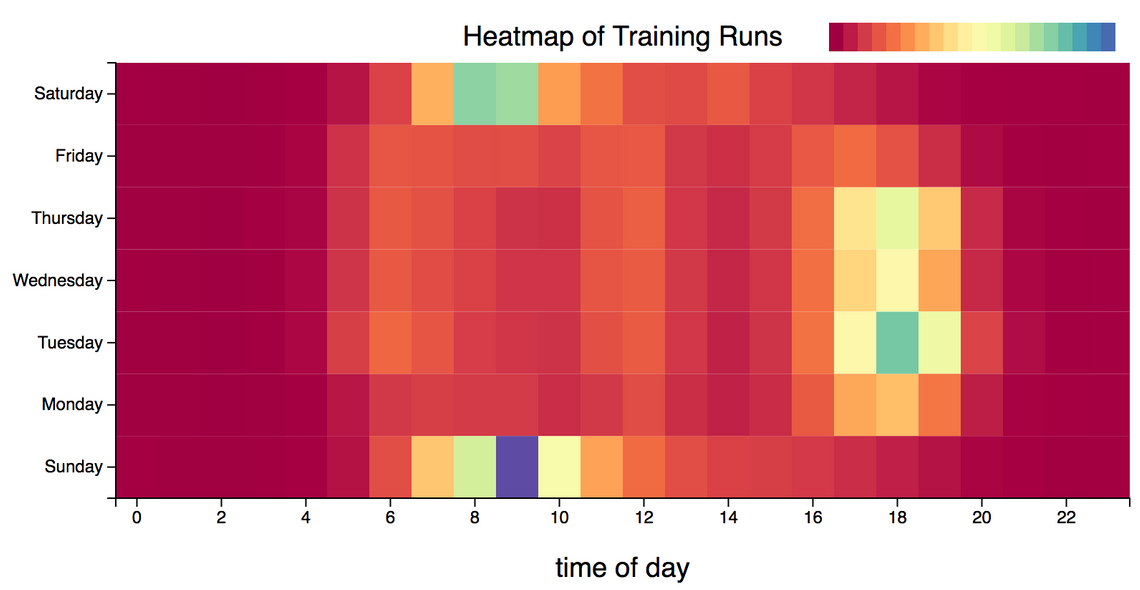
During the week, the most popular time to go for a run is Tuesday at 18:00. Friday is by far the least popular day for running (pub?!). On the weekdays you can see small peaks at 6:00 and 12:00, most likely people running before work or on their lunch break. Saturday morning sees a big peak around 9:00 most likely due to parkrun.
Overall the most popular time to head out for a run is 9:00 on a Sunday morning. There were 4,574 runs logged at this hour in the data I downloaded.
Splitting the data into three broad distance categories reveals some more interesting patterns:
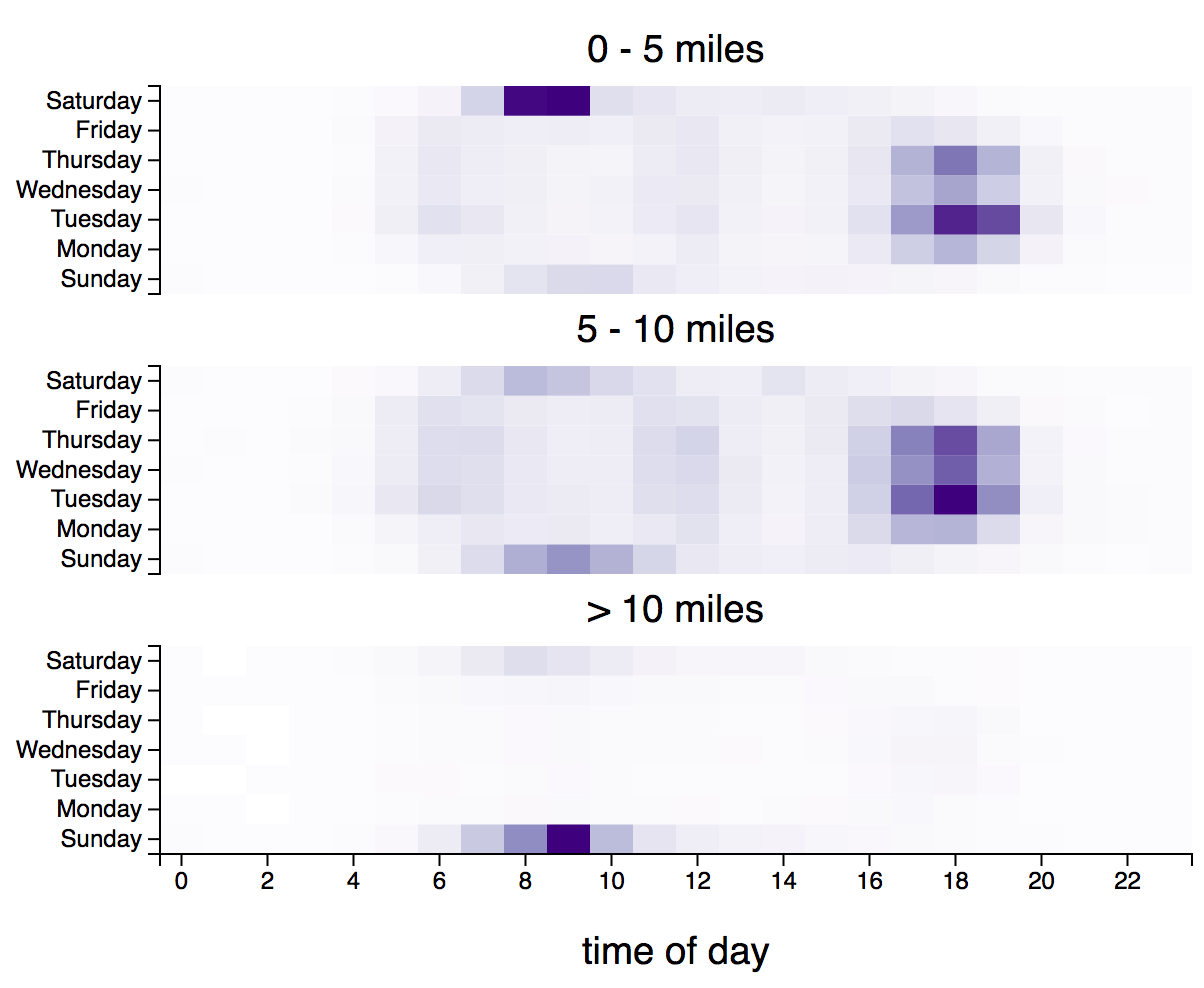
The Saturday morning peak in the 0-5 mile category confirms that parkruns are a very popular part of people’s weekly running routine. Mid-distance runs, of a 5-10 mile distance are typically run on Tuesdays-to-Thursdays at 18:00. And finally, long runs are almost exclusively a Sunday morning pursuit.
Conclusions
I’ve had a lot of fun digging into this data - there are so many other ways to slice and dice it! For example, I found that the most frequent longest run before the marathon was 20 miles, and as a general rule runners prefer to run an even number of miles than an odd number. I also found that those who finished in under 3 hours spent most of their time training below their marathon pace, whereas all the others spent more time training faster than their marathon pace.
With 1,000 athletes, and more than 100,000 runs there is so much more to discover.
If you’ve got an idea, or theory you want me to test, please leave a comment and I’ll see what I can find.
Regards, Colin E.