
Last week I attended the Open Source Strategy Forum (OSSF), a two-day conference organised by FINOS, a group that are encouraging open source collaboration within financial services organisations. If you’ve ever worked in financial services, you’ll understand just how challenging this is! Thankfully significant progress is being made, and in the future we’ll likely see contribution as well as consumption from these multi-national organisations.
One of the projects that caught my eye at OSSF was the recently launched Perspective from JP Morgan. This project is a streaming analytics engine, that uses WebAssembly - combining a couple of my favourite topics, WebAssembly and data visualisation. Perspective allows you to interactively create grids, pivots,and charts on top of streaming data sets.
This blog post explores Perspective in more detail, and also looks at how it can be coupled with d3fc, our own library of charting components, to provide a real-time visualisation of cryptocurrencies.
You can see the live visualisation on my d3 bl.ocks page.
Introducing Perspective
The Perspective APIs and design are very simple, there are just three core concepts that you need to understand:
table- these represent a single dataset, similar to a traditional database table. The data has an associated schema, which defines the types for each column (although this is typically inferred from the input data). Tables also expose methods for adding / removing rows.view- a view represents a transformation of the data held by a table, allowing for grouping, sorting, filtering, and more. When the data in a table is updated, its associated views are also updated.perspective-viewer- the viewer is a web component that renders a view, providing a UI that allows the user to configure and change the way the view slices / transforms the data. It allows the end-user to explore the data set without having to write any code.
Perspective itself also has some interesting implementation details. The core library that sits behind the table and view concepts is written in C++. This code is compiled to WebAssembly and executed using WebWorkers.
Anyhow, time to dive into the details.
For this example I’m rendering streaming cryptocurrency prices using the public coinbase feed. The code to obtain a list of products, and create a websocket subscription for orders / matches, is really quite straightforward:
const GDAX_URL = "https://api.pro.coinbase.com/",
  SOCKET_URL = "wss://ws-feed.pro.coinbase.com";

// obtain a product list
const res = await fetch(`${GDAX_URL}products`);
const products = await res.json();

const ws = new WebSocket(SOCKET_URL);

// subscribe
ws.onopen = () => {
  ws.send(
    JSON.stringify({
      type: "subscribe",
      product_ids: products.map(p => p.id)
    })
  );
};

// receive messages
ws.onmessage = msg => {
  console.log(JSON.parse(msg.data));
});
The following code results in a stream of messages being logged to the console:
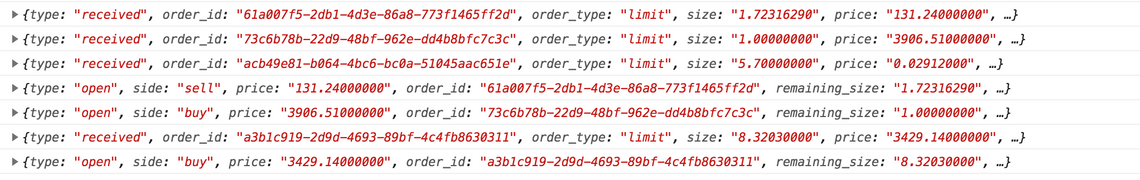
Feeding this data into Perspective couldn’t be easier, simply create a table, supplying a suitable number of rows, then associate this with the viewer:
let buffer = [];

ws.onmessage = msg => {
  const data = JSON.parse(msg.data);
  buffer.push(data);

  if (!initialised) {
    if (buffer.length > 200) {
      table = perspective.worker().table(buffer, {
        limit: 5000
      });

      // obtain a reference to the viewer element, which is added directly into the HTML
      const viewer = document.getElementsByTagName("perspective-viewer")[0];
      viewer.load(table);

      initialised = true;
    }
  }
};
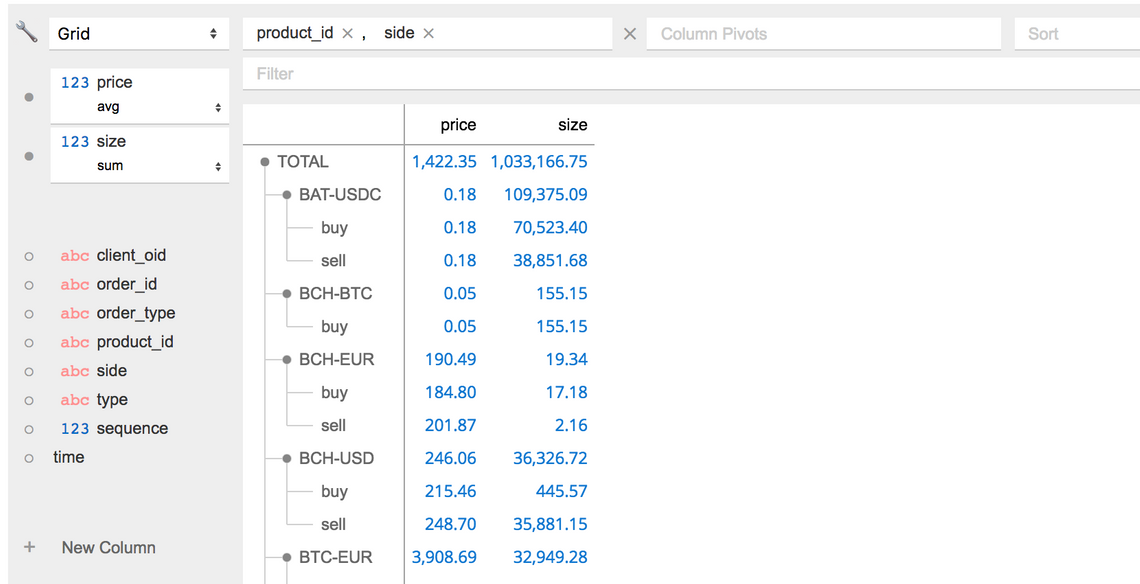
With this in place, you can see your data rendering in a grid, with various controls allowing you to group, sort and manipulate the data. Here’s an example which shows the average bid / ask price and total volume for each product:
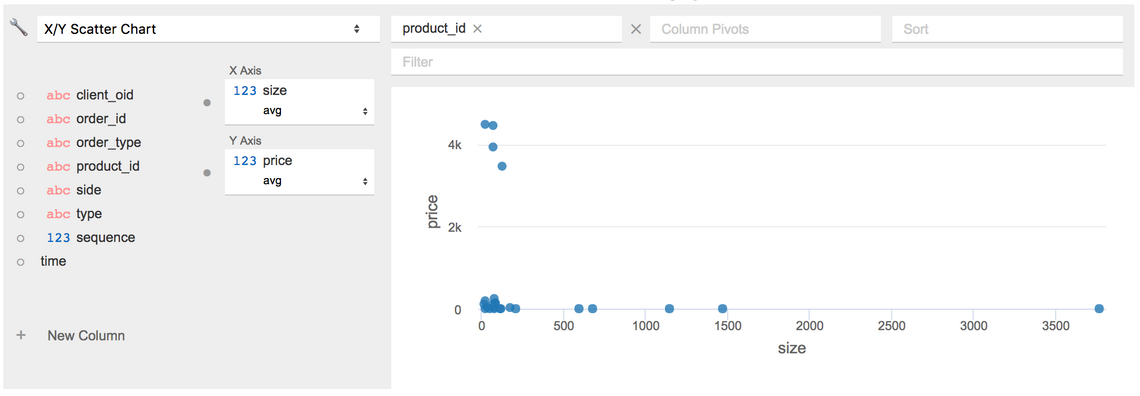
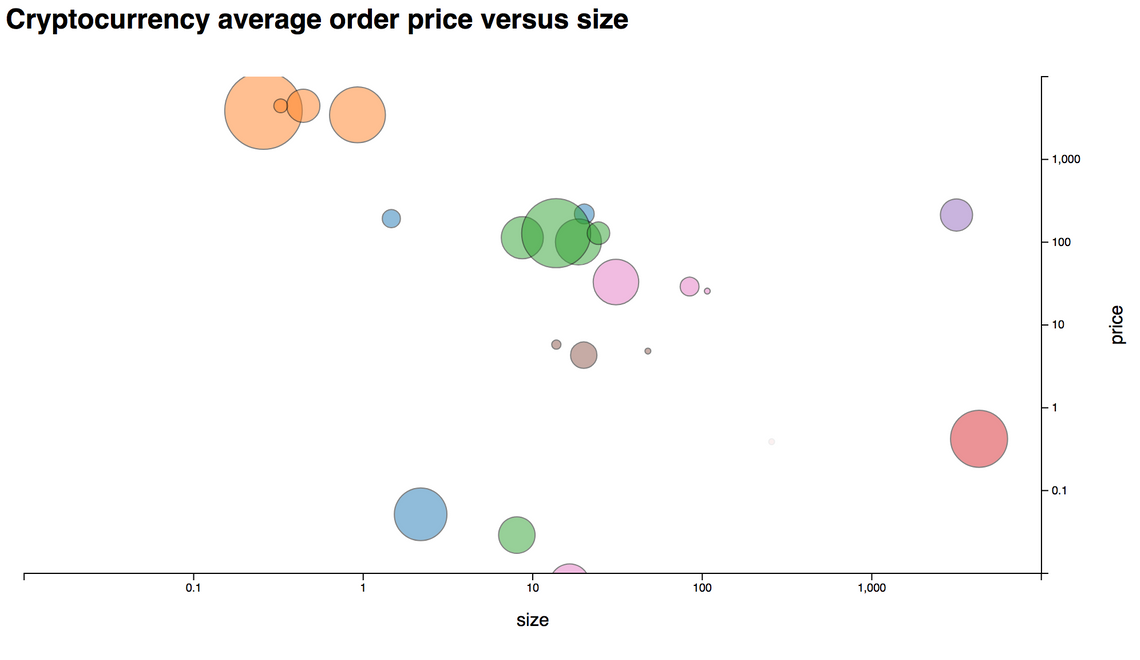
Perspective has a plugin model where new visualisation types can be added to perspective-viewer. Here’s an example of scatter chart showing the average price versus size for each product:
Handling streaming data is quite straightforward, new rows can be supplied to the table via its update method. Each time this is invoked, the views are updated and the visualisations re-render. With the coinbase feed you typically receive hundreds of updated a second, which requires some throttling.
A simple approach is to buffer updates, feeding them to the table via an interval timer:
setInterval(async () => {
  // to do - raise buffer.length bug
  if (initialised && buffer.length > 0 && !suppress) {
    table.update(buffer);
    buffer = [];
  }
}, 50);
Custom visualisations
Perspective has a versatile range of chart types, but configuration options are limited. In order to create bespoke visualisations it’s possible to work with the Perspective views directly.
The following configuration creates a view that groups by product, computing the average price and size, and total order count:
const scatterConfig = {
  filter: [["type", "==", "received"], ["side", "==", "buy"]],
  row_pivot: ["product_id"],
  column_pivot: [],
  aggregate: [
    { op: "avg", column: "price" },
    { op: "avg", column: "size" },
    { op: "count", column: "order_id" }
  ],
  sort: []
};

const scatterView = table.view(scatterConfig);
Our d3fc project has a number of D3 components which make it easy to create bespoke charts. The following code uses the to_colums method from the Perspective view to access the computed view. It uses the d3fc point series, and chart components to create a scatter plot. Additional D3 scales are used for determining the colour of each point, from the base currency, and the size, based on the total number of orders:
const color = d3
    .scaleOrdinal(d3.schemeCategory10)
    .domain(products.map(d => d.base_currency));

const render = async () => {
  // obtain the data and transform into a suitable shape for d3
  const scatterCols = await scatterView.to_columns();
  const series = scatterCols.__ROW_PATH__
    .map((p, i) => ({
      price: scatterCols.price[i],
      size: scatterCols.size[i],
      count: scatterCols.order_id[i],
      instrument: p[0]
    }))
    .slice(1);

  // create a scale for point size
  const size = d3
    .scaleLinear()
    .range([20, 3600])
    .domain(fc.extentLinear().accessors([d => d.count])(series));

  // create  apoint series
  const pointSeries = fc
    .seriesSvgPoint()
    .key(d => d.instrument)
    .crossValue(d => d.size)
    .mainValue(d => d.price)
    .size(d => size(d.count))
    .decorate(sel => {
      // colour based on base currency
      sel.attr("fill", d => color(d.instrument.split("-")[0]));
    });

  // create a chart
  const chart = fc
    .chartCartesian(d3.scaleLog(), d3.scaleLog())
    .xDomain([0.01, 10000])
    .yDomain([0.01, 10000])
    .xTickFormat(d3.format(","))
    .yTickFormat(d3.format(","))
    .xLabel("size")
    .yLabel("price")
    .xTickValues([0.1, 1, 10, 100, 1000])
    .yTickValues([0.1, 1, 10, 100, 1000])
    .svgPlotArea(pointSeries);

  // render
  d3.select("#chart")
    .datum(series)
    .transition()
    .duration(200)
    .call(chart);
};
Note that the d3 selection that renders the chart uses a transition so that changes in the position and size of each point are animated.
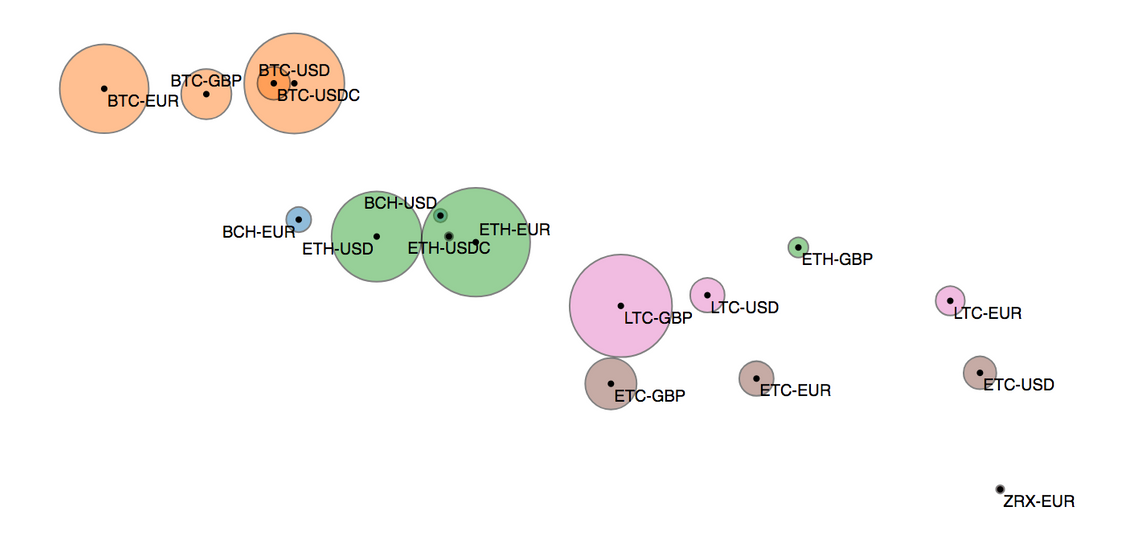
For the final version of the chart I added a little interactivity, on mouse over adding labels to each point so that the user can see which cryptocurrency is being represented. These labels use the d3fc label layout component, which positions the labels to minimise overlaps.
You can see the finished visualisation on my d3 bl.ocks page.
Conclusions
I was really impressed with how easy it was to supply data to Perspective and quickly start rendering data. This, coupled with the power of d3 / d3fc, allowed me to very quickly create a dynamic visualisation.
I’m sure we’ll be doing more with, and contributing to, Perspective in the future.
