
JP Morgan’s Perspective is an open source streaming analytics engine that uses WebAssembly to quickly analyse a dataset and display views via a plugin framework.
In Building a Perspective plugin with d3fc, I looked at how we used d3fc to render a generic graph view. In this post, I want to take a closer look at the Plugin API.
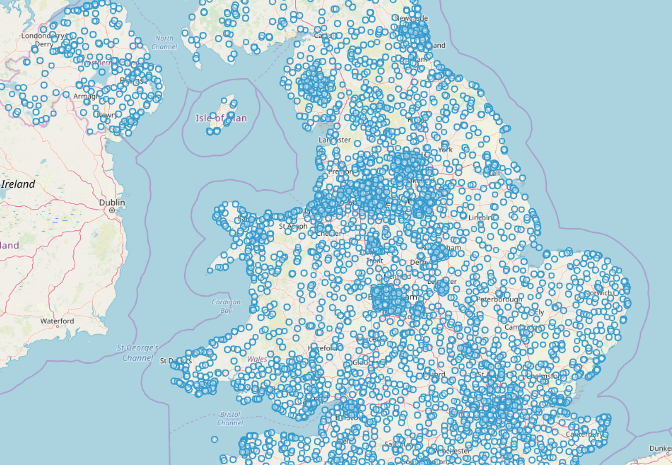
For this example I wanted something a bit different than the usual charts and grids, but with some visual appeal, so I have gone for a mapping plugin based on OpenLayers and OpenStreetMap.
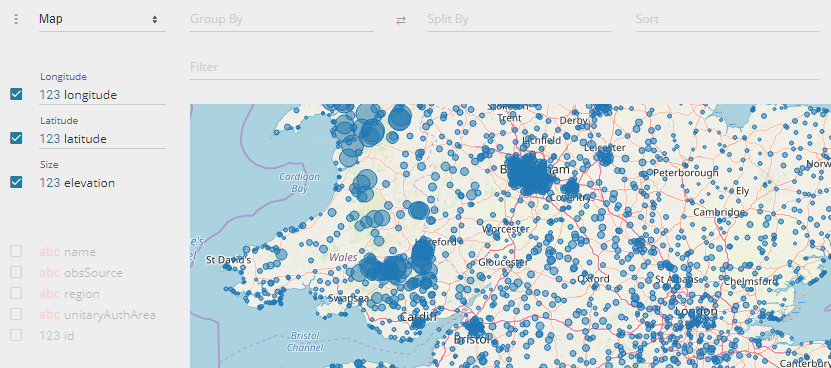
Here is a working example that you can interact with: Perspective Maps Example. Try dragging the region variable into “Split By” or “Filter” to see how you can manipulate the view.
The completed project is on GitHub: perspective-viewer-maps.
More examples:
NYC Citibike data based on Andrew Stein’s NYC Citibike Analytics blog: Perspective Maps with Citibike.
Map of airports on OpenFlights: Perspective map of world airports.
Getting Started
Creating a new plugin project is really easy. I have created a starter template for this purpose: perspective-viewer-template. I should note that this is my own template, not an official Perspective one, though hopefully sometime soon there will be an official option to get started with.
Copy it into a new project
Simply clone or copy the template into a new project (with a different name), and update the name in package.json. I called my example “perspective-viewer-maps”.
Run it
Install the dependencies and run it:
npm install
npm start
That’s it! The template comes with a default view that renders to a table:
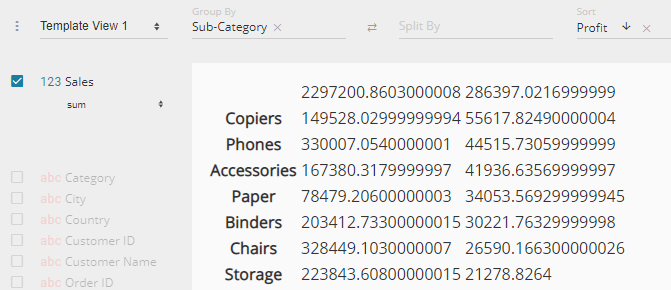
About the template
The default view is in /src/js/views/view-1.js. New views should be added to the list in /src/js/views/views.js.
A view is a function that takes container, config and settings parameters:
function myView(container, config, settings) {
  // Render view of config into container
  // Use settings object for persisting user settings
}
Geographic data
Next, I added a dataset to the included examples folder (Met Office sites with latitude/longitude), and updated index.html to show the new data.
window.addEventListener('WebComponentsReady', function () {
  var xhr = new XMLHttpRequest();
  xhr.open('GET', 'metSites.json', true);
  xhr.onload = function () {
    var el = document.getElementsByTagName('perspective-viewer')[0];
    el.load(perspective.worker().table(JSON.parse(xhr.response)));
  }
  xhr.send(null);
});
<perspective-viewer class="example" view="d3_xy_scatter" columns='["longitude","latitude"]'
aggregates='{"latitude":"avg","longitude":"avg"}'>
</perspective-viewer>Notice the latitude/longitude aggregates use avg rather than sum, since adding them together makes no sense. An average will give us the average position when grouping.
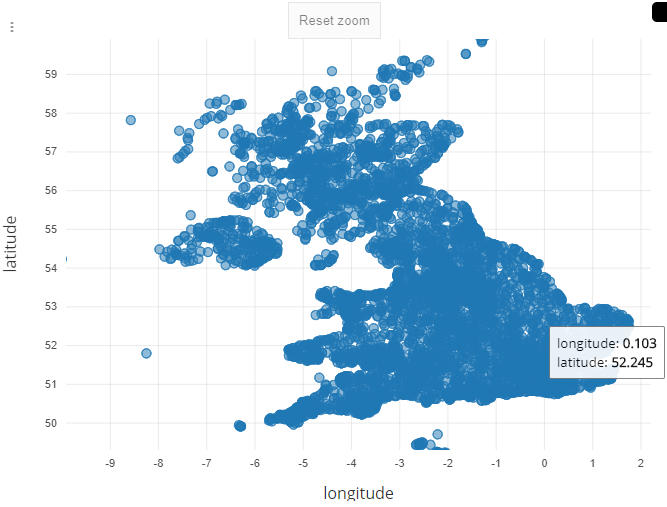
This view uses the included X/Y Scatter chart to show that we’ve loaded the data correctly.
Map view
So let’s show an actual map.
Configure the plugin’s view
Rename the template’s default view (“view-1”) to “map-view”, and give it some default parameters so that the user is prompted for “Longitude” and “Latitude”:
// views.js
import mapView from "./map-view";
const views = [mapView];
export default views;
// map-view.js (renamed from view-1.js)
function mapView(container, config, settings) {
// Render the view of this data
// …
}
mapView.plugin = {
type: "map_view",
name: "Map",
max_size: 25000,
initial: {
type: "number",
count: 2,
names: ["Longitude", "Latitude"]
}
};
export default mapView;Add OpenLayers with OpenStreetMap
Add OpenLayers to the project (npm install ol), and update the view function to render a simple map into the container:
import {Map, View} from "ol";
import TileLayer from "ol/layer/Tile";
import OSM from "ol/source/OSM";
import {fromLonLat} from "ol/proj";

function mapView(container, config, settings) {
    // Render the view of this data
    new Map({
        target: container,
        layers: [new TileLayer({source: new OSM()})],
        view: new View({center: fromLonLat([-4.02, 53.43]), zoom: 6.5})
    });
}
Bundle the CSS for OpenLayers
Perspective uses custom elements with shadow-DOM, which means that any CSS loaded at the document level will not apply to the plugin. However, we can bundle OpenLayers’ css with the plugin’s css by adding this line to the less file (plugin.less):
@import (inline) "../../node_modules/ol/ol.css";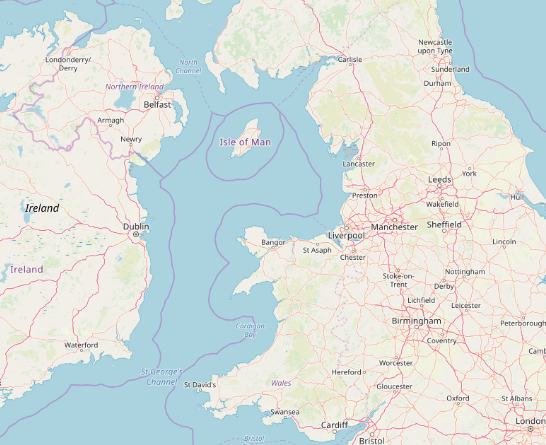
Plot the data
We need to turn the data from Perspective into a list of points. I’ve omitted the implementation of getMapData() from this example for brevity, and also because it’s going to change quite a lot later (when we start dealing with group-by and split-by options). For now it’ll be enough to take each row of the data, get the longitude and latitude values from it, and turn it into a “feature”.
// Render the view of this data
const data = getMapData(config.data);

const vectorSource = new VectorSource({
    features: data.map(point => new Feature(new Circle(fromLonLat(point), 5000)))
});
Housekeeping
At this point we need to take a step back and sort out a few things I’ve skipped over. I’ll try to be brief as the full implementation is available in the source.
Deal with grouped and split data
When the user drags a variable into the “Group By” box, Perspective will give us rows with a __ROW_PATH__ array (with a value for each group variable), and additional rows for the totals. For this plugin we’re not using the totals, so we filter out any row where __ROW_PATH__.length is less than the number of group variables (config.row_pivot.length).
When the user drags a variable into the “Split By” box, Perspective gives us rows where the values use a combined key of the split-by variables and the aggregate. e.g. if I use “region”, I’d see values like “sw|latitude” for the latitude value of the “sw” split, and “sw|longitude” etc… We’ll process these values and give each point a “category” label that we’ll use later to colour the points.
See the completed getMapData() function for full details.
Re-use the map object
At the moment it’s clearing the display and rendering a new map each time, so we need to re-arrange the code a little so that we can store the Map and VectorLayer as private data associated with the DOM node. We can then re-use them when the view is updated, and re-populate the VectorLayer with the new points.
Work out the initial view extents
My first example used a hard-coded location to show the whole of the UK. That works for my sample data, but wouldn’t be much use for anywhere else. We need a function that enumerates through the data to get minimum and maximum longitude and latitude. When we initialise the map view the first time, we can set the center and resolution to give us a suitable initial viewing area.
Extra features
Here are a few more features that I have added, and some things that I intend to continue to work on.
Colour based on “Split By” categories
When the user has picked a “Split By” value, we want to colour the points on the map based on which split / category they fall into.
I added an array of category colour values to the code. When there is a category available, we associate each category with one of the colours, and use that colour to style the circle on the map.
Size based on a third aggregate value
I’ve added a third (optional) variable to the plugin’s configuration to specify size:
mapView.plugin = {
    type: "map_view",
    name: "Map",
    max_size: 25000,
    initial: {
        type: "number",
        count: 2,
        names: ["Longitude", "Latitude", "Size"]
    }
};
When creating features for the map, we can use the “Size” value to set the feature’s size. We’ll need to enumerate the data to work out the minimum and maximum sizes, and also use a suitable default size as a fallback.
Tooltips and Click events
On a mouseover event, we just need to find the closest point and show a tooltip div with the associated data.
A click event is similar, but we need to send the associated data up to the hosting application to let it know what was clicked. We can do this using a custom event:
container.dispatchEvent(
    new CustomEvent("perspective-click", {
        bubbles: true, composed: true,
        detail: {
            column_names,
            config: {filters},
            row
        }
    })
);
In the event details:
-
column_namesrefers to the aggregate columns selected. In this case it’s all of them since you can’t click data that represents “Longitude” but not “Latitude” or “Size”. -
filtersshould be the list of filters that would need to be applied to anotherperspective-viewerto filter it to this data. i.e. it is the current filter combined with a filter representing the point that was clicked. -
rowis the original source row given to us byperspective-viewer.
A note about bundling
When I first tried to publish a working example of this project in Gist/Blocks, I couldn’t get the map tiles to load. It would give CORS errors, and lots of things I tried to solve that problem didn’t help. I eventually discovered that it works if the OpenLayers JavaScript is loaded separately, instead of bundled with the project, so that’s what the final version does. I’m not sure why, since it seems like it should work when bundled, but I didn’t get to the bottom of that problem (and it isn’t really related to the purpose of this article).
Conclusion
Creating a new plugin for Perspective really is quick and easy. Most of my time on this project was spent trying to figure out the CORS problem with OpenLayers! The core build took very little time.
Perspective gives us a powerful platform for manipulating all sorts of data ready to display, and the plugin system means that anyone can create their own view. I’m sure there are many different ways to display data than the traditional chart and grid views.
