D3 is often used for rendering chart visualisations, and our d3fc library extends D3 with some commonly used components such as series. It offers SVG implementations, which are a bit more flexible and easier to interact with, and Canvas implementations, which offer better performance for large data sets.
Eventually though, given enough data, even the Canvas renderers slow down. In almost all use-cases, you probably don’t want to see that much data on the screen anyway. Sometimes you might want to render it just so that you can see an overall pattern to the data, but in that case it’s usually possible to do some sort of 1-in-N sampling to make rendering possible.
Are there other use-cases? Perhaps you’re visualising a model of bacteria growth, or stars moving across the sky… Would it be worth trying to render the data using WebGL to see if we can get better performance? I wanted to learn WebGL anyway, so as part of that learning I decided to find out.
The project
I’ve created a GitHub project called d3fc-webgl for the WebGL implementations of “Point”, “Line”, “Bar” and “Area” series (along with the composition types “Multi”, “Repeat” and “Grouped”). These mirror the corresponding d3fc series components.
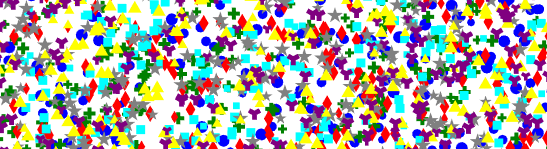
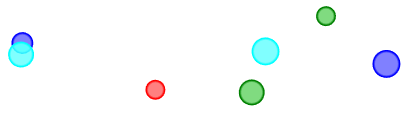
Here’s an example rendering up to 50,000 shapes moving around the screen, comparing Canvas to WebGL (click the link for a live demo).
Comparison of Canvas versus 2D WebGL
WebGL
This post is not going to be a tutorial for WebGL, since there are many excellent resources for that already. I used Mozilla’s WebGL tutorial, which was perfect for me - especially since it starts with a section called “Adding 2D content to a WebGL context”. Note that I didn’t get all the way through this tutorial since I got distracted - I’ll have to go back later for other interesting topics such as textures and lighting.
Why use WebGL for 2D rendering?
It seems like a strange thing to want to do. The 2D Canvas is designed for this task and performs well (and is faster than SVG). Why render a 2D scene in 3D space, only to project it back onto a 2D screen again?
Actually the 3D rendering is extremely simple (especially since we’re not doing textures or lighting). WebGL transforms each vertex in 3D space by simply multiplying it by a projection matrix, making it a point in 2D screen space. It then just has to work out what colour each pixel should be, based on three vertices making up a triangle. This is what the WebGL “shaders” do. What’s more, those shaders can run on the GPU, which is purpose built to run hundreds of tasks like this in parallel.
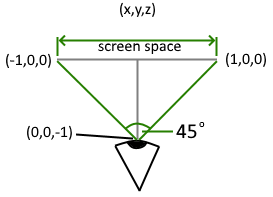
Our projection is about as simple as they get. We want the x and y axes to extend from -1 to 1, so we can position the viewer at z = -1 (0,0,-1) and use a 45 degree view angle.
WebGL shaders
Its those “shaders” that probably put a lot of people off, but actually they’re not that difficult to grasp, and the syntax should be familiar. Let’s have a look at the Mozilla examples…
The “Vertex shader” is run for each vertex, and projects the 3D position into 2D screen space.
  attribute vec4 aVertexPosition;

  uniform mat4 uModelViewMatrix;
  uniform mat4 uProjectionMatrix;

  void main() {
    gl_Position = uProjectionMatrix * uModelViewMatrix * aVertexPosition;
  }
The attribute aVertexPosition is the incoming vertex, and is different each time the shader is run. The two uniform matrices are the same each time, and project the vertex into 2D screen space. gl_Position is a special variable for the resulting screen position.
Vertices make up triangles, and the output of the vertex shader is passed to the “Fragment shader”, except this time it is run for each pixel within the triangle.
  void main() {
    gl_FragColor = vec4(1.0, 1.0, 1.0, 1.0);
  }
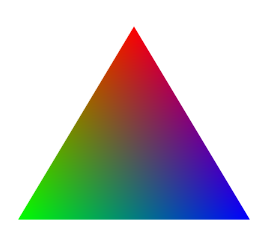
This shader just colours every pixel white, so isn’t very exciting. We’re probably going to need to pass in a colour from the application, so to do that we need to first pass the colour to the Vertex Shader, which outputs a colour for each vertex. If those colours aren’t the same then WebGL automatically interpolates them between the vertices (in fact it does that for any variable passed onto the fragment shader).
For example, a triangle with red, green and blue vertices looks like this:
Drawing 2D shapes
Now we’ve learned how to draw a triangle, drawing a bar chart should be simple - each bar is just two triangles joined together.
What about drawing lines? To do that, we actually need to turn each segment of the line into a box with the correct thickness (we can calculate the “normal” to find the corners of the box). The line is then a series of boxes, where each one is a pair of triangles. It seems like a pain, but once you’ve implemented a function for turning a line into a triangle strip, drawing lines becomes simple enough.
WebGL lets us chain together triangles as a “TRIANGLE_STRIP”, so that we don’t need to repeat two vertices each time we move onto the next triangle. You can also render a TRIANGLE_FAN, which uses the first point as one vertex in each triangle, with the remaining points fanning out around it. This seems perfect for our “Point” series, where each point is drawn as a circle (which is a “fan” of many triangles). However, doing it this way means we need to load up the buffers and make a “draw” call to WebGL for each data point. I found it performed faster by just rendering individual triangles, because that way we can render all the triangles for all the data points in a single buffer and one “draw” call.
As a quick aside, in DirectX and OpenGL, you get a third type of shader called a “Geometry shader”. That allows you to input one set of vertices, and output a different set of vertices for passing to the vertex shader. In our case, we could input the raw data points and use a geometry shader to calculate the set of triangles needed to render each point as a circle. Sadly, geometry shaders are not a part of WebGL, so I’ve had to do that processing in JavaScript.
WebGL series and the “Decorate” pattern
I wanted my WebGL series components to match the Canvas counterparts as much as possible. I’ve arranged the WebGL code so that it sets up the WebGL drawing surface once, then provides an API for each series to draw its shapes to.
We also need to be able to customise things like the line and fill colours, and line thickness. The canvas components use the “decorate” pattern for this, which gives the calling class the opportunity to set the strokeWidth, strokeStyle and fillStyle before drawing. You can read more about the decorate pattern here: d3fc decorate pattern.
I decided to mirror that pattern too, then read back those colours and the line thickness to use them when rendering the WebGL shapes.
WebGL series types
A “Line” series needs to generate the triangles for the line as described above, then render them as a triangle strip.
An “Area” series is just a series of filled triangles. If the “Decorate” pattern sets a strokeStyle, we can implement that by effectively drawing the corresponding “Line” series on top.
A “Bar” series requires two triangles for each bar. Like the points, it performs better if we use individual triangles rather than triangle strips. As with the “Area” series, if we need to outline the bars we can draw a line around each one, but in this case, that comes at a significant additional cost (since each bar needs its own line).
Point series
A point rendered as a circle requires many triangles. The bigger it is, the more triangles we need to make it look smooth. I mentioned above that it performs better using individual triangles rather than a triangle fan for each point. That’s because we can just load the buffer up and call “draw” once. What if we need to draw an outline around each point? In the Canvas implementation, it’s common to use a semi-transparent fill colour with a solid outline.
Drawing a line around each circle has a dramatic impact on performance. Instead of that, can we do something sneaky with the shader programs?
Sneaky shaders
Earlier I described how WebGL interpolates variables that are passed into the fragment shader. Can we make use of that somehow, as a way to use a different colour for pixels on the edge of a shape?
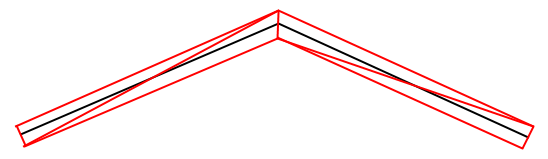
Consider this diagram:
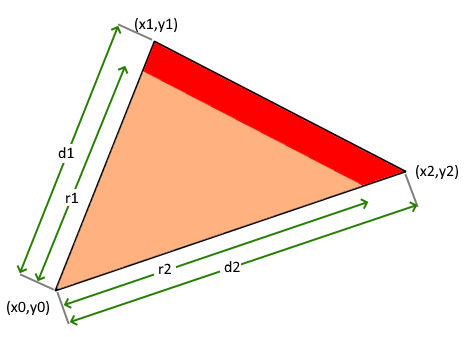
“d1” is the distance from vertex 0 to vertex 1, and “d2 is the distance from vertex 0 to vertex 2. If we pass this through to the fragment shader as a variable (using the value 0 for vertex 0), then the interpolated value will give us the distance from vertex 0 wherever we are in the triangle (remember that the fragment shader is working on individual pixels).
That seems like a great start, but we still need to work out what distance from vertex 0 means we should use the edge colour instead of the fill colour. To do this, let’s calculate “r1” and “r2” by subtracting the desired line thickness. We can also pass “r1” and “r2” through to the fragment shader, but here’s the important part: for vertex zero, we pass in the average (r1 + r2) / 2. The interpolated value will then tell us how far from vertex 0 we need to be in order to use the edge colour. Inside the shader, we can simply check whether “d” is bigger than “r”, and if so use the edge colour instead of the fill colour.
I have simplified that slightly - my final shader algorithm includes a couple of pixels where it merges the two colours, to give an anti-aliasing effect, which results in much smoother looking lines.
In my example visualisation, you’ll notice that there is a performance cost when you switch on “Borders”. That’s mostly due to the additional cost of calculating and transferring the extra buffer data (the “d” and “r” values). However, it’s much faster than trying to draw lines around all the points, and still performs considerably better than the Canvas version. If only we could do that processing in a geometry shader!
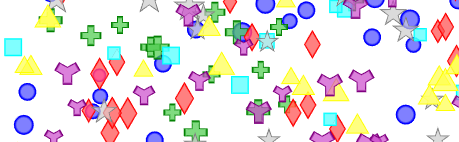
Other shapes
Finally, I used the symbol shapes provided by D3, that the canvas Point series supports. We can use D3 to get the set of points required to render that symbol, then use those points instead of points around the circumference of the circle.
Can WebAssembly help?
Earlier I mentioned that geometry shaders are not a part of WebGL, so I had to use JavaScript to convert an array of positions into a larger array of triangles for all those shapes.
As another experiment, I decided to see if WebAssembly could help us do that conversion faster. The short answer is “Yes”! Well, sometimes.
I’ll skip over the details for now (maybe this could be the subject of a follow-up post). I built a separate npm package called d3fc-webgl-proc. It means that the main project imports the compiled WebAssembly project, so you can work on that without having to setup your environment for compiling WebAssembly.
The intent was to process all the points for a series in a single call, and minimise copying arrays. The wasm “circles” function takes a Float32Array of (X, Y, Size, SegmentCount) information (the bigger the circle the more segments it needs), and returns a Float32Array of triangle vertices (X, Y). The “shapes” function is similar, but also takes in a small array containing the template of the shape.
For circles, the WebAssembly implementation is roughly 25% faster (around 35 FPS compared to 28 FPS for the same number of points). For the other shapes the improvement was much less dramatic at around 5-10% faster. That “circles” result is surprising, so I’ve tried to improve the JavaScript implementation, but I wasn’t able to get any closer to the WebAssembly speeds.
Conclusion
I set out to learn about WebGL, and I got part way there - I still need to go back and learn about textures and lighting!
I also set out to learn whether 2D rendering in WebGL could be faster than canvas. For that point, I’ll refer you back to my example:
Comparison of Canvas versus 2D WebGL
On my machine, I get around 30 FPS for 20,000 points in WebGL, versus only 3 FPS in Canvas, so a factor of 10 improvement. In fact, the WebGL version can scale up to 50,000 points while still looking smooth (15 FPS). In a similar test, using simple triangles about 2 pixels wide, I could render 100,000 points at 17 FPS, 200,000 at 9 FPS, and even 500,000 at 3 FPS (maybe acceptable in some applications).
Perhaps this does open up new visualisations after all.