
Introduction
Using Playwright snapshots with mocked data can significantly improve the speed at which UI regression is carried out. It facilitates rapid automated inspection of UI elements across the three main browsers (Chromium, Firefox, Webkit). You can tie multiple assertions to one snapshot, which greatly increases efficiency for UI testing. This type of efficiency is pivotal in a rapidly scaling GUI application. Playwright is a powerful automation library that is extensively used for regression testing. It excels at web-driven tests, i.e., navigating to links and executing various user flows that should always exhibit the same behaviour. While it’s common to automate user flow tests to verify how things should function, what about how things should look?
The problem
The main challenge was to create a dashboard that shows discrepancies between forecasted air quality and the real time measurements. The main page was simple enough as it was using ag grid, hence we could mock and assert values within each cell. However, it would not be as simple with chart-like elements. We needed to test that the data in these charts was visualised correctly with default mocked data and then, we needed to test that the various UI interactions transform the charts as expected.
Please find full context in this case study.
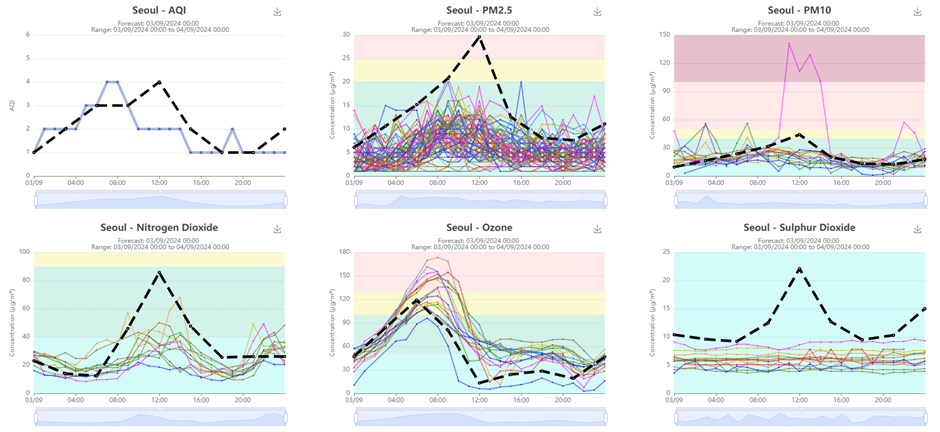
Shown above is the UI consisting of six different charts that show forecasted and in-situ pollutant measurements. The first big problem is that the data is non-static. We solve this by mocking data via Playwright Mock API. This way, our regression focuses on the functionality and various transformations that the data undergoes. The second problem is how do we know that the actual data is being visualised correctly? This is where Playwright snapshots come in.
Playwright snapshotting explained
Playwright will startup each browser and complete various actions such as button clicks, scrolls, data entry. Once actions have been executed, a screenshot of the DOM element(s) state will be captured. It will then sequentially look at each pixel and check if its RGBA values match up to the comparison image created in the codebase.
With Playwright snapshots we can easily assert how a page element should look. Provided that we don’t have a comparison image in the codebase our first run of npx playwright test will create a comparison image for us. Now we must tweak our test steps until we are satisfied with the snapshot created by playwright. Once satisfied we now run the same command with the flag --update-snapshots which then saves the snapshot as our golden standard referral image. Now each time we run the test we will compare against that image.
Note that a comparison image will be created for each of the browsers we have enabled. So, if I run toMatchSnapshot('Image.png') then it will create separate images for Chrome, Firefox and Webkit.
Example snippets
Without any additional parameters, the comparison will fail if a single pixel is different. This option allows for maximum accuracy.
test('Verify so2 graph updates correctly when sites are removed', async ({
    cityPage,
  }) => {
    //action to remove an air quality sensor site
    await cityPage.siteRemover('Centro')
    //Capture a snapshot of the sulphur dioxide chart
    const chartShot = await cityPage.captureChartScreenshot(cityPage.so2Chart)
    //Compare it with the reference we have saved in our codebase
    expect(chartShot).toMatchSnapshot('rio-so2-graph-without-centro.png')
  })
Here we have created a method within a page object model that takes in the chart/graph that we would like to screenshot at the end of the test for comparison. The element in the test for chrome browser is 600x400 pixels so this means that if a 1/240000 pixels do not match then the test will result in failure. However, we can give some leeway by providing extra parameters such as:
“maxDiffPixels”
.toMatchSnapshot("in-situ-AQI-is-4-at-00:00-due-to-PM2.5.png",{ maxDiffPixels: 27 })
If 27/240000 pixels are different then the test will pass. 28/240000 different pixels will fail the test.
“maxDiffPixelRatio”
.toMatchSnapshot("in-situ-AQI-is-4-at-00:00-due-to-PM2.5.png",{ maxDiffPixelRatio: 27 })
This is instead a percentage check. If up to 27% of the pixels do not match, then the test will still pass. Upon running the test through playwright CLI commands, a report is generated at the end of the test. This will show us what is different in the image.
What does failure look like?
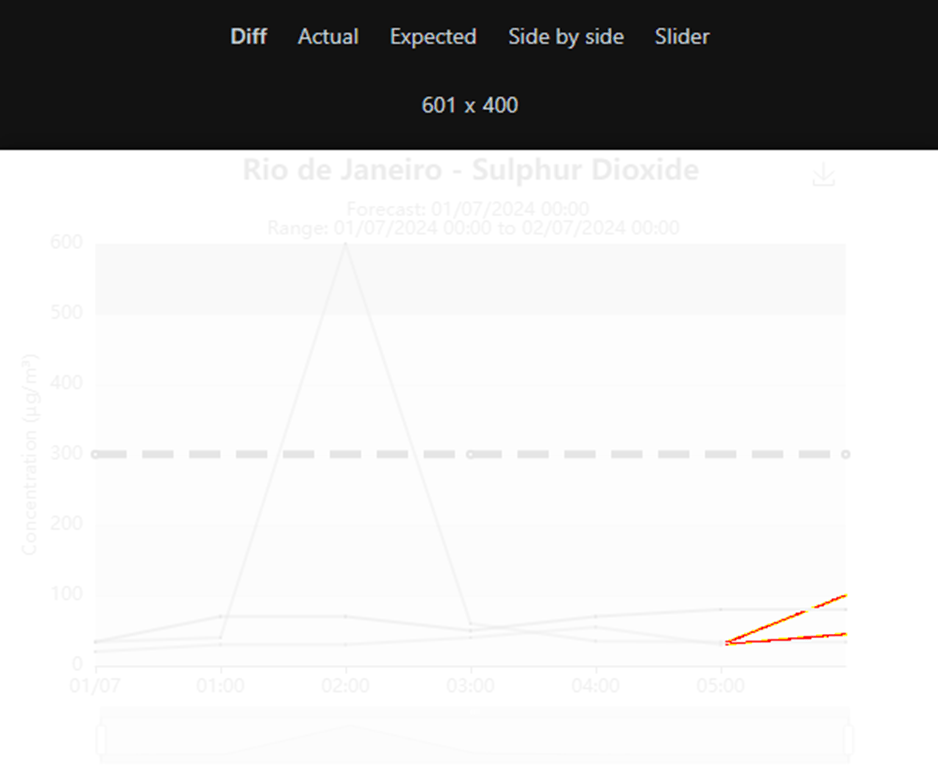
From running the tests from CLI a report is generated on localhost:9323 by default.
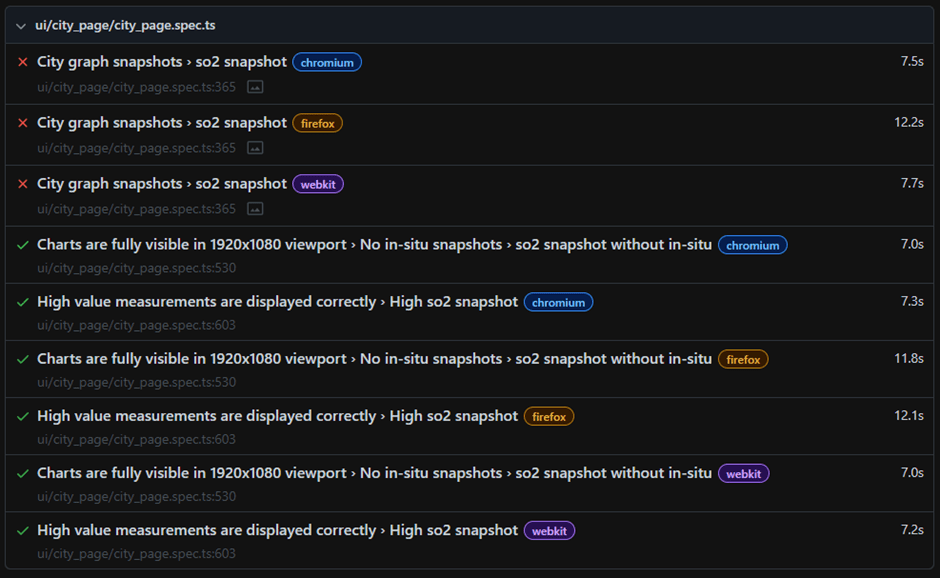
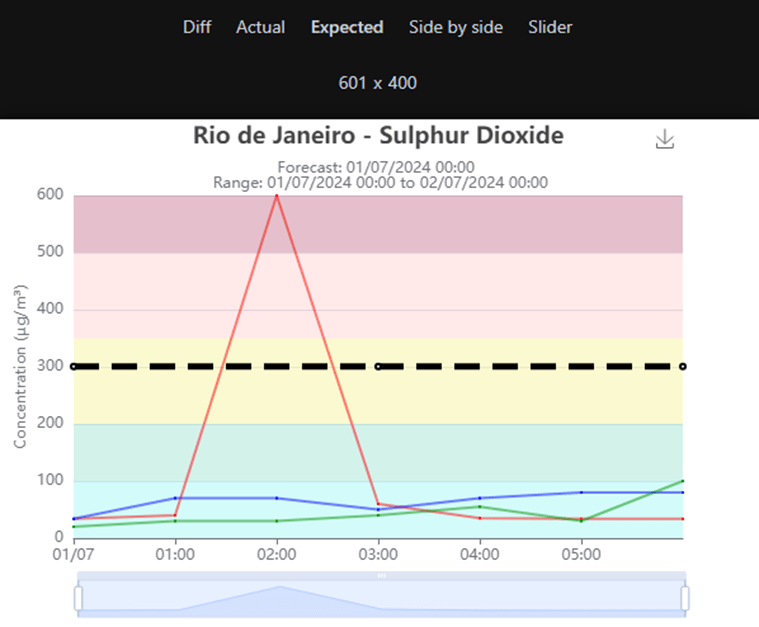
The user can then select a failing snapshot test and be able to see various comparison options. As shown below there are multiple options to select from to further investigate failure. We can view the expected image, the actual image but most importantly the difference. This is the most useful view as it will highlight all pixels that failed to match up to our comparison image.
Expected:
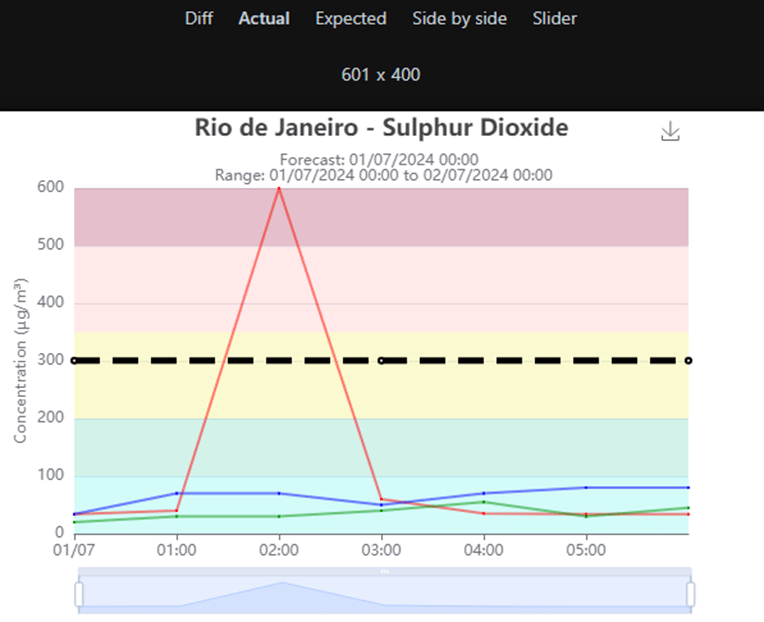
Actual:
Diff:
Usage examples
Through a mixture of mocked data and snapshot visual tests, it becomes easy to see any obvious regressions of the system functionality. Testing multiple charts in regression would quickly become monotonous and time consuming. Particularly for our UI there were many different forms that the graph could take.
Here is a sensor selection feature on the city page:
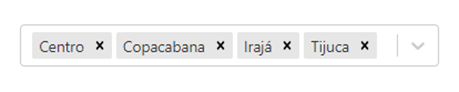
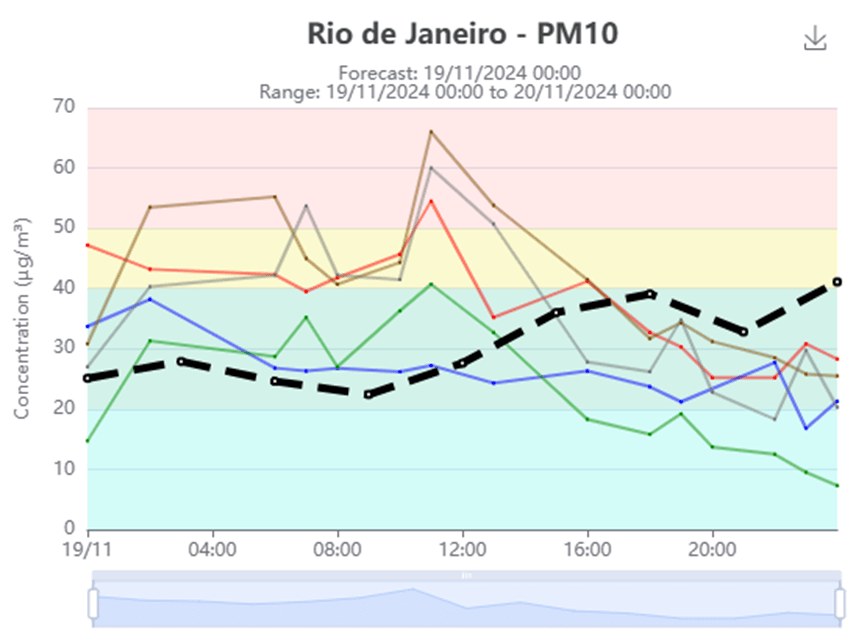
Each different coloured line on the graph is a different sensor which can be toggled. We can disable sensors through the selection tab or by double clicking a line on the actual chart. Then the chart will reform itself to better present the data.
Example Test flow:
- Snapshot the default graphs with mocked data.
- Remove a site.
- Now create a new snapshot of the graph with its updated shape.
Now we can have some tests that remove different sites and assert the new expected shape of the chart.
Shown below is the main AQI chart. The blue in situ line changes dynamically based on which sensors are enabled. This is done through frontend averaging of each point at a certain time. Then the highest average is plotted in blue.
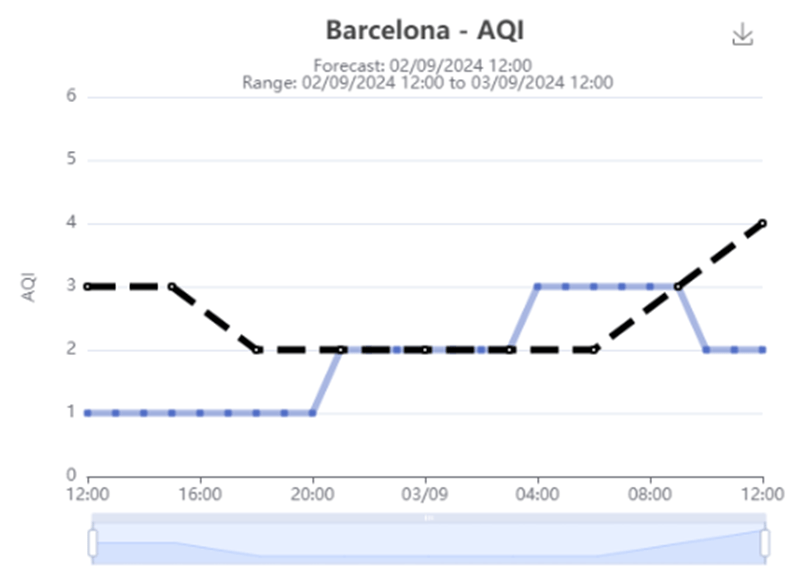
Test flow: We want to test that the blue line is plotted accurately based on which sites are enabled. So we remove our site(s) and then manualy check that the new plot is correct. Once happy we can then repeat steps to create a new snapshot of our altered chart. Finally, our test will simply navigate to the page, remove a site and assert that the chart matches the snapshot we just captured.
What does this solve?
It solves the issue of trying to assert on many different elements that may be quite tedious to locate and assert on elements one by one. This page is using the echarts library to render the graphs.
- It’s almost like a second pair of eyes. If we have a good understanding of how the data should look, then it makes UI regression testing much more efficient.
- Apart from failure due to incorrect data visualisation, we can also catch onto many other unintentional changes such as changes to padding or margins.
- Saves on some lengthy manual work. As shown above we could have to manually check and click around on 6 different charts which would be very time consuming if regression is carried out on a per-ticket basis.
-
Sometimes you can expect the element to be visible but the actual contents of it may be misrepresented or broken.
- We can rapidly test that the element’s data is represented correctly across multiple browsers/viewports. This will reduce workload even more on multi-platform applications.
Maintenance and change
Snapshot testing requires very close coordination within your team. When new changes are being made, it is important as a tester to know or investigate which snapshots need to be updated. Then this will simply require working with a dev to make sure that the new snapshots are in line with any new implementations . To be more efficient, we eventually agreed as a team to update these snapshots as part of the ticket either on the dev branch or on a separate one. This means that new implementations are merged into main with updated snapshots to reduce many failures on regression runs.
Updating snapshots is quite painless with the -–update-snapshots flag.
Example snapshot update
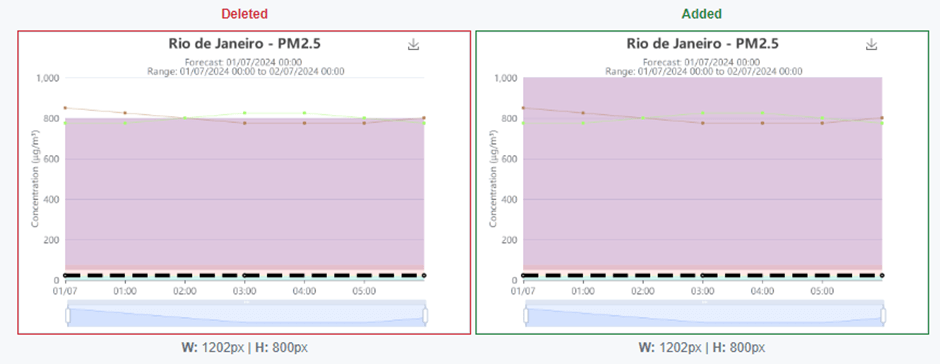
An updated snapshot of new implementation. Previously the background colour grading stopped at a maximum eight hundred. Now updated to have no upper boundary.
Naming conventions
It is also important to name your snapshots something significant. This makes it much easier for anyone on the team to understand their purpose. This also makes it easier to debug.
- “graph-image.png” vs “graph-is–bristol-air-quality”. By using something similar to the latter you will have a better idea of which functions are failing.
Useful functions
  async siteRemover(location: string) {
    await this.siteForm.waitFor({ state: 'visible' })
    await this.siteForm.scrollIntoViewIfNeeded()
    const siteDeselect = this.page.getByLabel(`Remove ${location}`)
    await siteDeselect.click()
  }
There are many different issues can cause your screenshot tests to become flaky. Like any other playwright test, make sure to use functions such as waitFor({ state: visible }) and scrollIntoViewIfNeeded(). This will ensure that you capture your screenshots accurately each time.
We can also use waitFor({ state: hidden }) on elements that indicate loading states.
In our project we also implemented a network polling method which would ensure that all network activity had ceased before taking a screenshot for some elements. This proved to be very usefull in some scenarios where the screenshot may not be accurate due to it being in a loading state.
Efficient mocking using Playwright
Mocking data is another important piece of the puzzle. Originally, we started out by simply extracting a JSON object and then exporting it from a helper file. This ended up being quite hefty in terms of actual code (sometimes reaching four thousand lines of mocked data for a test item). We then cut down on unnecessary code by using overridden interfaces.
interface forecastAPIResponse {
  base_time: string
  valid_time: string
  location_type: string
  location_name: string
  location: { longitude: number; latitude: number }
  overall_aqi_level: number
  no2: { aqi_level: number; value: number }
  o3: { aqi_level: number; value: number }
  pm2_5: { aqi_level: number; value: number }
  pm10: { aqi_level: number; value: number }
  so2: { aqi_level: number; value: number }
}
This meant that we could now have a default mock values and only change what we needed within the actual test scenario.
export function createForecastAPIResponseData(
  overrides: Partial<forecastAPIResponse> = {},
): forecastAPIResponse {
  const defaultForecastResponse = {
    base_time: '2024-07-08T00:00:00Z',
    valid_time: '2024-07-08T00:00:00Z',
    location_type: 'city',
    location_name: 'Los Angeles',
    location: { longitude: -22.90642, latitude: -43.18223 },
    overall_aqi_level: 3,
    no2: { aqi_level: CaseAQI3.aqiLevel, value: CaseAQI3.no2 },
    o3: { aqi_level: CaseAQI3.aqiLevel, value: CaseAQI3.o3 },
    pm2_5: { aqi_level: CaseAQI3.aqiLevel, value: CaseAQI3.pm2_5 },
    pm10: { aqi_level: CaseAQI3.aqiLevel, value: CaseAQI3.pm10 },
    so2: { aqi_level: CaseAQI3.aqiLevel, value: CaseAQI3.so2 },
  }
  return { ...defaultForecastResponse, ...overrides }
}
Now here is a usage example for test setup. We want to keep everything else the same and only change four values.
test.describe('City graph snapshots', () => {
  test.beforeEach(async ({ cityPage, page, banner }) => {
    const mockedForecastResponse = [
      createForecastAPIResponseData({
        base_time: '2024-07-01T00:00:00Z',
        valid_time: '2024-07-01T00:00:00Z',
        location_name: 'Rio de Janeiro',
        overall_aqi_level: 1,
      })
    ]

// Fufill mock and begin test steps

  })
})
This saved us from having to mock many objects for tests using different endpoints. Therefore, cutting down on a lot of code and making the test easier to follow and maintain.
Conclusion
Playwright snapshot testing is easy to setup, and even the API mocking is quite simple. It should also be used judiciously. The team must work very closely to make sure that the snapshots are maintained and updated appropriately when need be. Especially if these snapshots tests are part of a CI/CD regression pipeline. You should also know the exact scope of what is being tested as mocked data in Playwright may inadvertently bypass any API functionalities. This is why it’s mainly useful for front facing UI functionality rather than full E2E flows. It is an excellent addition to any rapidly scaling GUI application as it ends up saving a lot of time in any test phases.